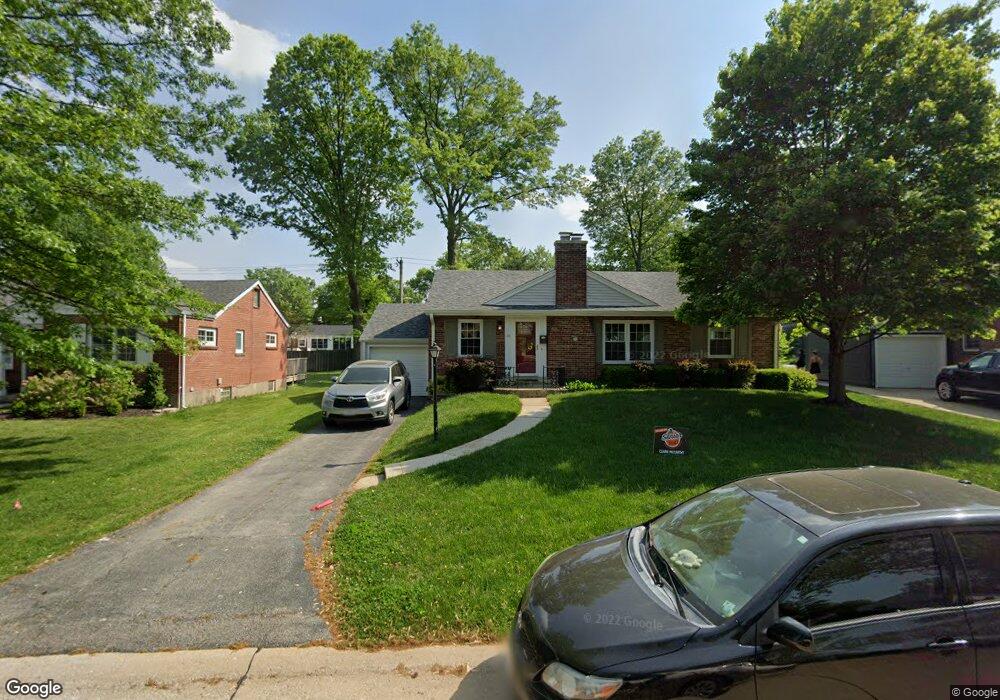
46 W Drake Ave Saint Louis, MO 63119
Estimated Value: $339,000 - $360,000
3
Beds
1
Bath
1,338
Sq Ft
$261/Sq Ft
Est. Value
About This Home
This home is located at 46 W Drake Ave, Saint Louis, MO 63119 and is currently estimated at $349,048, approximately $260 per square foot. 46 W Drake Ave is a home located in St. Louis County with nearby schools including Clark Elementary School, Hixson Middle School, and Webster Groves High School.
Ownership History
Date
Name
Owned For
Owner Type
Purchase Details
Closed on
Oct 28, 2016
Sold by
Schiebel Susan and Schiebel William A
Bought by
Schiebel William A and Schiebel Susan
Current Estimated Value
Home Financials for this Owner
Home Financials are based on the most recent Mortgage that was taken out on this home.
Original Mortgage
$187,500
Outstanding Balance
$150,412
Interest Rate
3.48%
Mortgage Type
New Conventional
Estimated Equity
$198,636
Purchase Details
Closed on
May 26, 2010
Sold by
Prudential Relocation Inc
Bought by
Mccarthy Susan
Home Financials for this Owner
Home Financials are based on the most recent Mortgage that was taken out on this home.
Original Mortgage
$176,621
Interest Rate
5.5%
Mortgage Type
FHA
Purchase Details
Closed on
Aug 15, 2003
Sold by
Knaup Constance Thomas
Bought by
Curtis Eric and Curtis Ami
Home Financials for this Owner
Home Financials are based on the most recent Mortgage that was taken out on this home.
Original Mortgage
$171,147
Interest Rate
5.87%
Mortgage Type
FHA
Create a Home Valuation Report for This Property
The Home Valuation Report is an in-depth analysis detailing your home's value as well as a comparison with similar homes in the area
Home Values in the Area
Average Home Value in this Area
Purchase History
| Date | Buyer | Sale Price | Title Company |
|---|---|---|---|
| Schiebel William A | -- | Integrity Title Solutions Ll | |
| Mccarthy Susan | $179,000 | None Available | |
| Prudential Relocation Inc | $179,000 | None Available | |
| Curtis Eric | $172,500 | -- |
Source: Public Records
Mortgage History
| Date | Status | Borrower | Loan Amount |
|---|---|---|---|
| Open | Schiebel William A | $187,500 | |
| Closed | Mccarthy Susan | $176,621 | |
| Previous Owner | Curtis Eric | $171,147 |
Source: Public Records
Tax History Compared to Growth
Tax History
| Year | Tax Paid | Tax Assessment Tax Assessment Total Assessment is a certain percentage of the fair market value that is determined by local assessors to be the total taxable value of land and additions on the property. | Land | Improvement |
|---|---|---|---|---|
| 2025 | $3,508 | $60,250 | $34,730 | $25,520 |
| 2024 | $3,508 | $50,270 | $24,700 | $25,570 |
| 2023 | $3,491 | $50,270 | $24,700 | $25,570 |
| 2022 | $3,500 | $46,800 | $21,620 | $25,180 |
| 2021 | $3,489 | $46,800 | $21,620 | $25,180 |
| 2020 | $3,211 | $40,070 | $21,620 | $18,450 |
| 2019 | $3,193 | $40,070 | $21,620 | $18,450 |
| 2018 | $3,003 | $33,440 | $15,430 | $18,010 |
| 2017 | $2,983 | $33,440 | $15,430 | $18,010 |
| 2016 | $2,880 | $30,930 | $11,570 | $19,360 |
| 2015 | $2,883 | $30,930 | $11,570 | $19,360 |
| 2014 | $2,602 | $27,130 | $10,370 | $16,760 |
Source: Public Records
Map
Nearby Homes
- 30 Webster Oaks Dr
- 134 Firwood Dr
- 26 Webster Oaks Dr
- 1509 Holly Dr
- 147 Firwood Dr
- 1330 Drayton Ave
- 12 Webster Acres
- 52 Webster Acres
- 107 Saint George Place
- 1316 Webster Forest Ct
- 432 Reavis Place Unit 20
- 8509 Grantshire Ln
- 1139 Hawken Place Unit 6
- 308 Oak Tree Dr
- 312 Oak Tree Dr
- 614 Conover Ln
- 430 Cannonbury Dr
- 8261 Watson Rd
- 1543 Fournier Dr
- 1353 Webster Path Dr