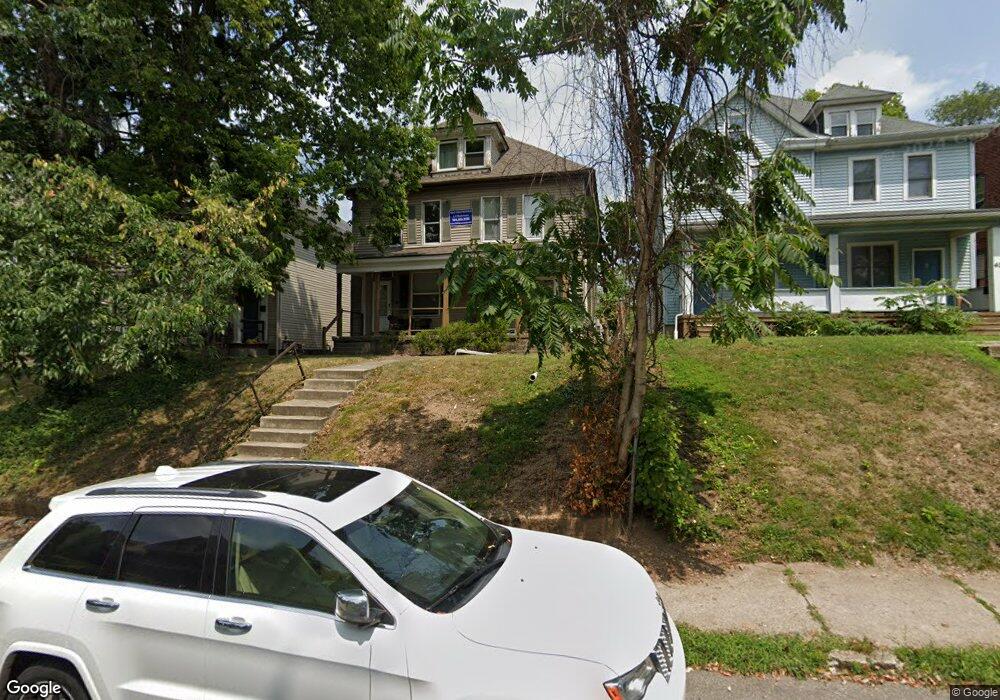
46 W Patterson Ave Unit 48 Columbus, OH 43202
Old North Columbus NeighborhoodEstimated Value: $512,000
8
Beds
2
Baths
3,422
Sq Ft
$150/Sq Ft
Est. Value
About This Home
This home is located at 46 W Patterson Ave Unit 48, Columbus, OH 43202 and is currently priced at $512,000, approximately $149 per square foot. 46 W Patterson Ave Unit 48 is a home located in Franklin County with nearby schools including Hubbard Elementary School, Dominion Middle School, and Whetstone High School.
Ownership History
Date
Name
Owned For
Owner Type
Purchase Details
Closed on
Oct 26, 2004
Sold by
Crawford Real Estate Llc
Bought by
Crawford Real Estate Ii Ltd
Current Estimated Value
Purchase Details
Closed on
May 30, 2002
Sold by
Crawford Phil
Bought by
Crawford Real Estate Llc
Purchase Details
Closed on
Nov 20, 2001
Sold by
Crawford Real Estate Ltd
Bought by
Crawford Phil
Home Financials for this Owner
Home Financials are based on the most recent Mortgage that was taken out on this home.
Original Mortgage
$51,300
Interest Rate
6.68%
Mortgage Type
Purchase Money Mortgage
Purchase Details
Closed on
Aug 10, 1994
Sold by
Weese Ann M
Bought by
Crawford Danny L and Crawford Carol A
Home Financials for this Owner
Home Financials are based on the most recent Mortgage that was taken out on this home.
Original Mortgage
$213,600
Interest Rate
8.62%
Mortgage Type
New Conventional
Create a Home Valuation Report for This Property
The Home Valuation Report is an in-depth analysis detailing your home's value as well as a comparison with similar homes in the area
Home Values in the Area
Average Home Value in this Area
Purchase History
| Date | Buyer | Sale Price | Title Company |
|---|---|---|---|
| Crawford Real Estate Ii Ltd | -- | -- | |
| Crawford Real Estate Llc | -- | -- | |
| Crawford Phil | $51,300 | -- | |
| Crawford Danny L | $267,000 | -- |
Source: Public Records
Mortgage History
| Date | Status | Borrower | Loan Amount |
|---|---|---|---|
| Previous Owner | Crawford Phil | $51,300 | |
| Previous Owner | Crawford Danny L | $213,600 |
Source: Public Records
Tax History Compared to Growth
Tax History
| Year | Tax Paid | Tax Assessment Tax Assessment Total Assessment is a certain percentage of the fair market value that is determined by local assessors to be the total taxable value of land and additions on the property. | Land | Improvement |
|---|---|---|---|---|
| 2024 | $8,162 | $178,090 | $37,350 | $140,740 |
| 2023 | $8,060 | $178,080 | $37,345 | $140,735 |
| 2022 | $6,510 | $122,500 | $27,160 | $95,340 |
| 2021 | $6,522 | $122,500 | $27,160 | $95,340 |
| 2020 | $6,531 | $122,500 | $27,160 | $95,340 |
| 2019 | $6,094 | $98,010 | $21,740 | $76,270 |
| 2018 | $5,186 | $98,010 | $21,740 | $76,270 |
| 2017 | $5,402 | $98,010 | $21,740 | $76,270 |
| 2016 | $4,711 | $69,340 | $18,310 | $51,030 |
| 2015 | $4,289 | $69,340 | $18,310 | $51,030 |
| 2014 | $4,299 | $69,340 | $18,310 | $51,030 |
| 2013 | $1,927 | $63,000 | $16,625 | $46,375 |
Source: Public Records
Map
Nearby Homes
- 6 E Blake Ave
- 9 E Norwich Ave Unit 15
- 198 E Maynard Ave
- 204 E Blake Ave Unit 206
- 223-225 E Maynard Ave
- 185 E Tompkins St
- 223 E Patterson Ave
- 241 E Blake Ave
- 217 E Oakland Ave
- 2627 Neil Ave
- 2537 Medary Ave Unit 539
- 2683 Neil Ave Unit 685
- 2251 Indiana Ave
- 261 E Northwood Ave Unit 40
- 69 E Arcadia Ave
- 2127 Indiana Ave
- 328 Wyandotte Ave Unit 326
- 109-117 E Arcadia Ave
- 2350 Indiana Ave
- 2395 Summit St Unit 397
- 50 W Patterson Ave Unit 52
- 40 W Patterson Ave Unit 42
- 42 W Patterson Ave
- 56 W Patterson Ave Unit 58
- 32 W Patterson Ave
- 60 W Patterson Ave
- 62 W Patterson Ave Unit 64
- 37 E Maynard Ave
- 43 W Maynard Ave Unit 45
- 49 W Maynard Ave Unit 51
- 24 W Patterson Ave
- 53 W Maynard Ave
- 2357 1/2 N High St
- 2357 N High St
- 2355 1/2 N High St
- 59 W Maynard Ave Unit 61
- 41 W Patterson Ave Unit 43
- 51 W Patterson Ave Unit 53
- 72 W Patterson Ave Unit 74
- 39 W Patterson Ave