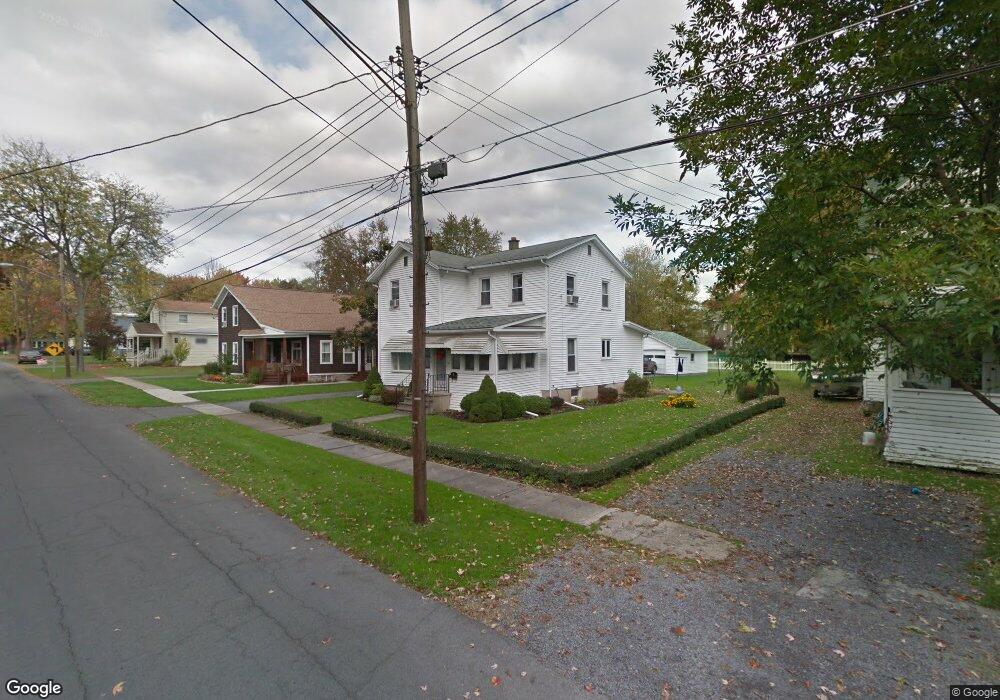
46 Walnut St Seneca Falls, NY 13148
Estimated Value: $172,000 - $193,000
4
Beds
2
Baths
2,240
Sq Ft
$82/Sq Ft
Est. Value
About This Home
This home is located at 46 Walnut St, Seneca Falls, NY 13148 and is currently estimated at $184,209, approximately $82 per square foot. 46 Walnut St is a home located in Seneca County with nearby schools including Frank M. Knight Elementary School, Elizabeth Cady Stanton Elementary School, and Seneca Falls Middle School.
Ownership History
Date
Name
Owned For
Owner Type
Purchase Details
Closed on
Apr 18, 2024
Sold by
Reed Carol and Reed Donald
Bought by
Carol J Reed Ret and Reed
Current Estimated Value
Purchase Details
Closed on
Jan 18, 2017
Sold by
Giovannetti Genevieve C
Bought by
Giovannetti Francis P
Purchase Details
Closed on
Jun 13, 2000
Sold by
Ross Pamela G
Bought by
Young William
Create a Home Valuation Report for This Property
The Home Valuation Report is an in-depth analysis detailing your home's value as well as a comparison with similar homes in the area
Home Values in the Area
Average Home Value in this Area
Purchase History
| Date | Buyer | Sale Price | Title Company |
|---|---|---|---|
| Carol J Reed Ret | -- | None Available | |
| Carol J Reed Ret | -- | None Available | |
| Carol J Reed Ret | -- | None Available | |
| Giovannetti Francis P | -- | Samuel P Giacona | |
| Giovannetti Francis P. Campbell Elizabeth | -- | Samuel P Giacona | |
| Young William | $72,200 | -- | |
| Young William | $72,200 | -- |
Source: Public Records
Tax History
| Year | Tax Paid | Tax Assessment Tax Assessment Total Assessment is a certain percentage of the fair market value that is determined by local assessors to be the total taxable value of land and additions on the property. | Land | Improvement |
|---|---|---|---|---|
| 2024 | $4,052 | $147,000 | $15,500 | $131,500 |
| 2023 | $41 | $147,000 | $15,500 | $131,500 |
| 2022 | $3,709 | $88,400 | $12,000 | $76,400 |
| 2021 | $3,682 | $88,400 | $12,000 | $76,400 |
| 2020 | $2,114 | $88,400 | $12,000 | $76,400 |
| 2019 | $1,270 | $88,400 | $12,000 | $76,400 |
| 2018 | $2,005 | $88,400 | $12,000 | $76,400 |
| 2017 | $1,974 | $88,400 | $12,000 | $76,400 |
| 2016 | $1,568 | $88,400 | $12,000 | $76,400 |
| 2015 | -- | $73,000 | $12,700 | $60,300 |
| 2014 | -- | $73,000 | $12,700 | $60,300 |
Source: Public Records
Map
Nearby Homes
Your Personal Tour Guide
Ask me questions while you tour the home.