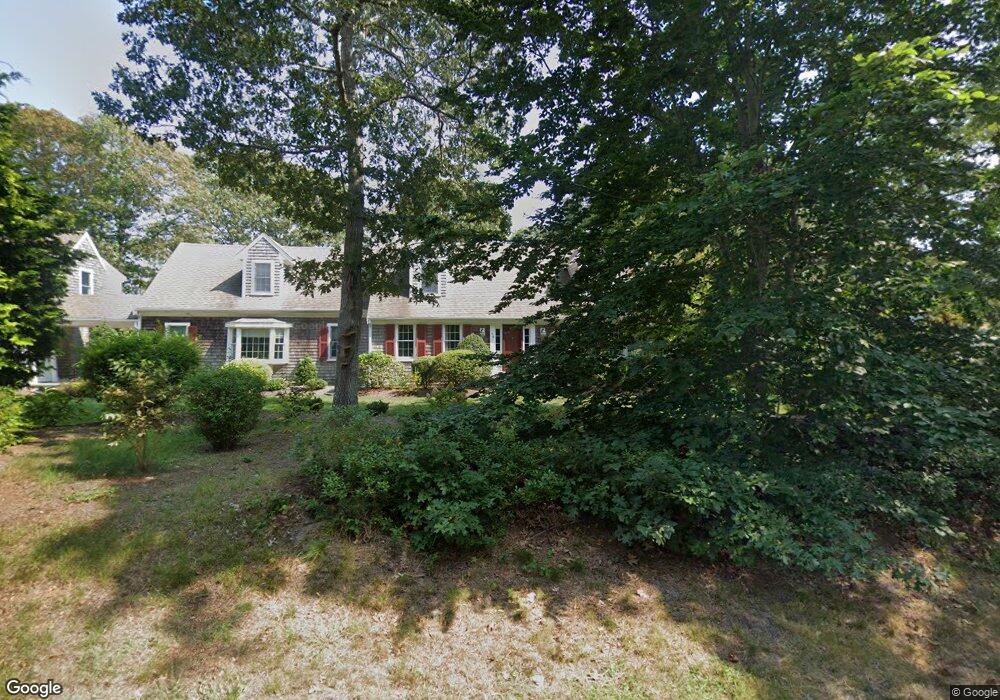
46 West St Osterville, MA 02655
Osterville NeighborhoodEstimated Value: $2,350,000 - $2,695,000
4
Beds
5
Baths
3,044
Sq Ft
$830/Sq Ft
Est. Value
About This Home
This home is located at 46 West St, Osterville, MA 02655 and is currently estimated at $2,527,550, approximately $830 per square foot. 46 West St is a home located in Barnstable County with nearby schools including West Villages Elementary School, Barnstable United Elementary School, and Barnstable Intermediate School.
Ownership History
Date
Name
Owned For
Owner Type
Purchase Details
Closed on
Jan 31, 2022
Sold by
Kathleen E Capo T
Bought by
Locicero Giovanna A
Current Estimated Value
Purchase Details
Closed on
Aug 13, 2010
Sold by
Agc T
Bought by
Kathleen E Capo T
Home Financials for this Owner
Home Financials are based on the most recent Mortgage that was taken out on this home.
Original Mortgage
$462,000
Interest Rate
4.63%
Create a Home Valuation Report for This Property
The Home Valuation Report is an in-depth analysis detailing your home's value as well as a comparison with similar homes in the area
Home Values in the Area
Average Home Value in this Area
Purchase History
| Date | Buyer | Sale Price | Title Company |
|---|---|---|---|
| Locicero Giovanna A | -- | None Available | |
| Kathleen E Capo T | -- | -- |
Source: Public Records
Mortgage History
| Date | Status | Borrower | Loan Amount |
|---|---|---|---|
| Previous Owner | Kathleen E Capo T | $462,000 |
Source: Public Records
Tax History
| Year | Tax Paid | Tax Assessment Tax Assessment Total Assessment is a certain percentage of the fair market value that is determined by local assessors to be the total taxable value of land and additions on the property. | Land | Improvement |
|---|---|---|---|---|
| 2025 | $15,771 | $1,949,500 | $1,074,700 | $874,800 |
| 2024 | $14,855 | $1,902,100 | $1,074,700 | $827,400 |
| 2023 | $14,262 | $1,710,100 | $977,000 | $733,100 |
| 2022 | $11,022 | $1,143,400 | $528,900 | $614,500 |
| 2021 | $10,925 | $1,041,500 | $512,200 | $529,300 |
| 2020 | $11,262 | $1,027,600 | $512,200 | $515,400 |
| 2019 | $10,996 | $974,800 | $512,200 | $462,600 |
| 2018 | $10,592 | $944,000 | $597,700 | $346,300 |
| 2017 | $9,594 | $891,600 | $597,700 | $293,900 |
| 2016 | $9,535 | $874,800 | $586,500 | $288,300 |
| 2015 | $9,421 | $868,300 | $592,100 | $276,200 |
Source: Public Records
Map
Nearby Homes
- 207 Crystal Lake Rd
- 51 Wianno Cir
- 146 Scudder Rd
- 501 Eel River Rd
- 414 Eel River Rd
- 16 2nd Ave Unit 4
- 168 Garrison Ln
- 33 Sunset Ln
- 850 Sea View Ave
- 77 Robbins St
- 39 Tower Hill Rd Unit 1C
- 920 Main St Unit 1 Building 2
- 920 Main St Unit 2-1
- 53 Spice Ln
- 414 Eel
- 39 Blossom Ave Unit 4
- 29 Oak Ridge Rd
- 117 Parsley Ln
- 67 Fire Station Rd
- 40 Waterfield Rd
- 34 West St
- 242 Washington Ave
- 242 Washington Ave
- 232 Washington Ave
- 252 Sea View Ave
- 264 Sea View Ave
- 264 Sea View Ave
- 70 West St
- 282 Sea View Ave
- 25 East Ave
- 226 Washington Ave
- 242 Sea View Ave
- 80 West St
- 216 Washington Ave
- 19 Warren St
- 265 Sea View Ave
- 300 Sea View Ave
- 215 Washington Ave
- 224 Washington
- 204 Washington Ave
Your Personal Tour Guide
Ask me questions while you tour the home.