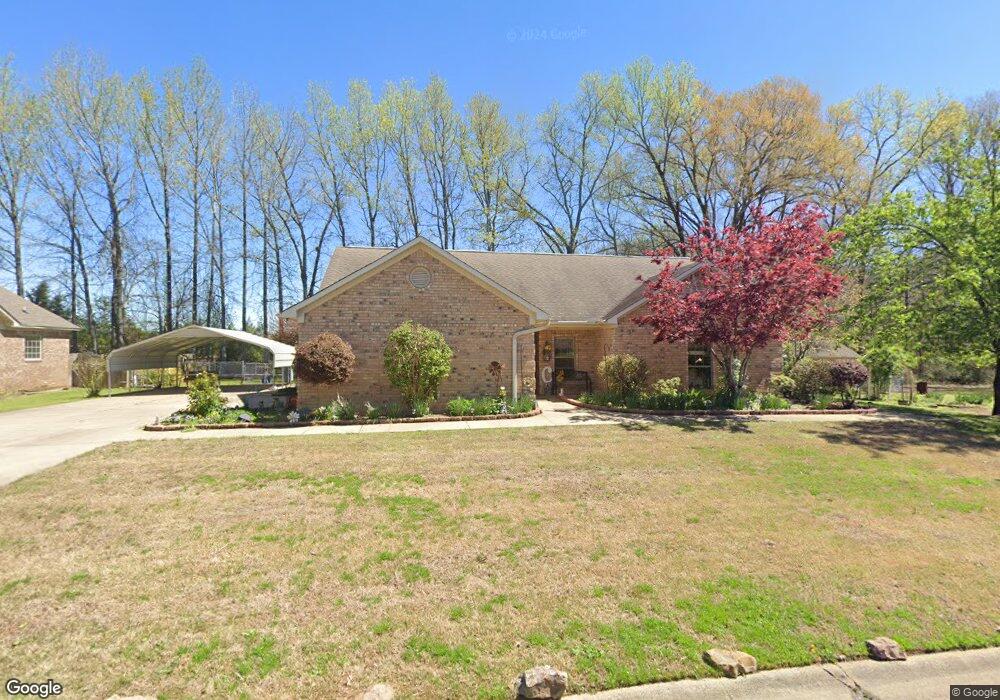
46 Whispering Wind Cir Vilonia, AR 72173
Estimated Value: $192,000 - $217,000
--
Bed
2
Baths
1,511
Sq Ft
$135/Sq Ft
Est. Value
About This Home
This home is located at 46 Whispering Wind Cir, Vilonia, AR 72173 and is currently estimated at $204,193, approximately $135 per square foot. 46 Whispering Wind Cir is a home located in Faulkner County with nearby schools including Vilonia Junior High School and Vilonia High School.
Ownership History
Date
Name
Owned For
Owner Type
Purchase Details
Closed on
Jul 15, 2024
Sold by
Rodgers Brittany A and Rodgers Bryan
Bought by
Rodgers Brittany A and Rodgers Bryan
Current Estimated Value
Home Financials for this Owner
Home Financials are based on the most recent Mortgage that was taken out on this home.
Original Mortgage
$140,000
Outstanding Balance
$138,328
Interest Rate
6.99%
Mortgage Type
New Conventional
Estimated Equity
$65,865
Purchase Details
Closed on
Nov 3, 2009
Bought by
Rodgers
Home Financials for this Owner
Home Financials are based on the most recent Mortgage that was taken out on this home.
Original Mortgage
$125,510
Interest Rate
5.03%
Mortgage Type
New Conventional
Purchase Details
Closed on
May 30, 2008
Bought by
Ord 2008-1
Purchase Details
Closed on
Jul 14, 2006
Bought by
Fleharty
Purchase Details
Closed on
Jul 13, 2006
Bought by
Fleharty
Purchase Details
Closed on
Aug 10, 2005
Bought by
Wilson
Purchase Details
Closed on
Aug 9, 2005
Bought by
Wilson
Create a Home Valuation Report for This Property
The Home Valuation Report is an in-depth analysis detailing your home's value as well as a comparison with similar homes in the area
Home Values in the Area
Average Home Value in this Area
Purchase History
| Date | Buyer | Sale Price | Title Company |
|---|---|---|---|
| Rodgers Brittany A | -- | None Listed On Document | |
| Rodgers | $123,000 | -- | |
| Rodgers Brittany A | $123,000 | Conway Title Svcs & Escrow I | |
| Ord 2008-1 | -- | -- | |
| Fleharty | $19,000 | -- | |
| Fleharty | $19,000 | -- | |
| Wilson | $12,000 | -- | |
| Wilson | $12,000 | -- |
Source: Public Records
Mortgage History
| Date | Status | Borrower | Loan Amount |
|---|---|---|---|
| Open | Rodgers Brittany A | $140,000 | |
| Previous Owner | Rodgers Brittany A | $125,510 |
Source: Public Records
Tax History Compared to Growth
Tax History
| Year | Tax Paid | Tax Assessment Tax Assessment Total Assessment is a certain percentage of the fair market value that is determined by local assessors to be the total taxable value of land and additions on the property. | Land | Improvement |
|---|---|---|---|---|
| 2025 | $1,488 | $39,600 | $3,000 | $36,600 |
| 2024 | $1,426 | $39,600 | $3,000 | $36,600 |
| 2023 | $1,358 | $26,520 | $3,000 | $23,520 |
| 2022 | $976 | $26,520 | $3,000 | $23,520 |
| 2021 | $914 | $26,520 | $3,000 | $23,520 |
| 2020 | $853 | $23,980 | $3,000 | $20,980 |
| 2019 | $821 | $23,360 | $3,000 | $20,360 |
| 2018 | $846 | $23,360 | $3,000 | $20,360 |
| 2017 | $846 | $23,360 | $3,000 | $20,360 |
| 2016 | $846 | $23,360 | $3,000 | $20,360 |
| 2015 | $1,268 | $25,460 | $3,000 | $22,460 |
| 2014 | $918 | $25,460 | $3,000 | $22,460 |
Source: Public Records
Map
Nearby Homes
- 63 Vilsonia Way
- 4 Whispering Wind Cir
- 2 Old Hickory Rd W
- 00 Highway 64 E
- 18 Rush Creek Dr
- 24 Clover Ridge Dr
- 525 Naylor Rd
- 1 Dove Creek Dr
- 81 Farmhouse Cir
- Lot 4 Vilanco Ln
- Lot 3 Vilanco Ln
- 83 Farmhouse Cir
- 85 Farmhouse Cir
- 87 Farmhouse Cir
- 82 Farmhouse Cir
- 89 Farmhouse Cir
- 84 Farmhouse Cir
- 86 Farmhouse Cir
- 88 Farmhouse Cir
- 36 Hearthstone Trail
- 40 Whispering Wind Cir
- 45 Whispering Wind Cir
- 38 Whispering Wind Cir
- 48 Whispering Wind Cir
- 47 Whispering Wind Cir
- 33 Whispering Wind Cir
- 36 Whispering Wind Cir
- 31 Whispering Wind Cir
- 49 Whispering Wind Cir
- 50 Whispering Wind Cir
- 34 Whispering Wind Cir
- 29 Whispering Wind Cir
- 51 Whispering Wind Cir
- 52 Whispering Wind Cir
- 32 Whispering Wind Cir
- 27 Whispering Pine Cir
- 30 Whispering Wind Cir
- 53 Whispering Wind Cir
- 25 Whispering Wind Cir
- 28 Whispering Wind Cir