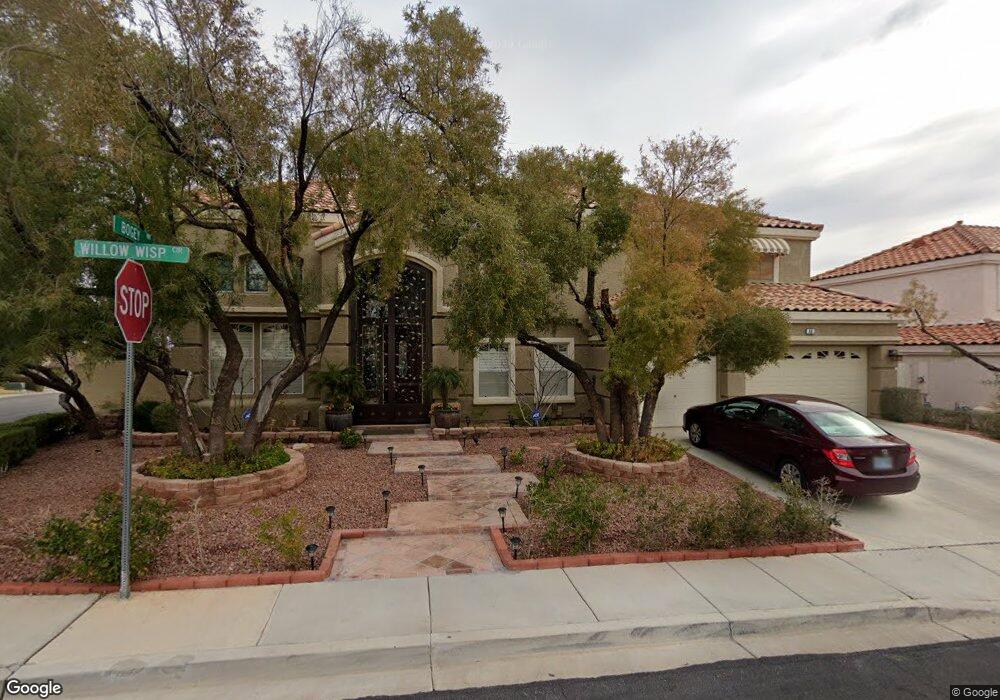
46 Willow Wisp Terrace Henderson, NV 89074
Green Valley South NeighborhoodEstimated Value: $686,579 - $834,000
5
Beds
3
Baths
3,223
Sq Ft
$236/Sq Ft
Est. Value
About This Home
This home is located at 46 Willow Wisp Terrace, Henderson, NV 89074 and is currently estimated at $760,645, approximately $236 per square foot. 46 Willow Wisp Terrace is a home located in Clark County with nearby schools including Selma F Bartlett Elementary School, Barbara and Hank Greenspun Junior High School, and Coronado High School.
Ownership History
Date
Name
Owned For
Owner Type
Purchase Details
Closed on
Mar 12, 2021
Sold by
Judith Suzuki
Bought by
Judith Suzuki Trust
Current Estimated Value
Home Financials for this Owner
Home Financials are based on the most recent Mortgage that was taken out on this home.
Original Mortgage
$264,580
Interest Rate
2.73%
Mortgage Type
Balloon
Purchase Details
Closed on
May 27, 2020
Sold by
Suzuki Judith
Bought by
Suzuki Judith and Judith Suzuki Trust
Purchase Details
Closed on
Nov 22, 1994
Sold by
Coleman Homes Inc
Bought by
Suzuki Tony and Suzuki Judith
Home Financials for this Owner
Home Financials are based on the most recent Mortgage that was taken out on this home.
Original Mortgage
$249,250
Interest Rate
4.87%
Create a Home Valuation Report for This Property
The Home Valuation Report is an in-depth analysis detailing your home's value as well as a comparison with similar homes in the area
Home Values in the Area
Average Home Value in this Area
Purchase History
| Date | Buyer | Sale Price | Title Company |
|---|---|---|---|
| Judith Suzuki Trust | -- | None Listed On Document | |
| Suzuki Judith | -- | None Listed On Document | |
| Suzuki Judith | -- | None Available | |
| Suzuki Tony | $277,000 | First American Title Company |
Source: Public Records
Mortgage History
| Date | Status | Borrower | Loan Amount |
|---|---|---|---|
| Previous Owner | Suzuki Judith | $264,580 | |
| Previous Owner | Suzuki Tony | $249,250 |
Source: Public Records
Tax History
| Year | Tax Paid | Tax Assessment Tax Assessment Total Assessment is a certain percentage of the fair market value that is determined by local assessors to be the total taxable value of land and additions on the property. | Land | Improvement |
|---|---|---|---|---|
| 2026 | $2,699 | $156,723 | $66,150 | $90,573 |
| 2025 | $2,620 | $156,964 | $64,400 | $92,564 |
| 2024 | $2,545 | $156,964 | $64,400 | $92,564 |
| 2023 | $2,545 | $142,455 | $53,725 | $88,730 |
| 2022 | $2,471 | $124,826 | $43,680 | $81,146 |
| 2021 | $2,399 | $113,896 | $36,400 | $77,496 |
| 2020 | $2,326 | $112,792 | $35,700 | $77,092 |
| 2019 | $2,258 | $108,142 | $31,850 | $76,292 |
| 2018 | $2,192 | $102,852 | $29,750 | $73,102 |
| 2017 | $3,018 | $104,116 | $29,750 | $74,366 |
| 2016 | $2,076 | $100,146 | $24,150 | $75,996 |
| 2015 | $2,072 | $91,150 | $16,100 | $75,050 |
| 2014 | $2,012 | $67,369 | $16,975 | $50,394 |
Source: Public Records
Map
Nearby Homes
- 1842 Bogey Way
- 1861 Bogey Way
- 75 N Valle Verde Dr Unit 223
- 75 N Valle Verde Dr Unit 621
- 75 N Valle Verde Dr Unit 521
- 75 N Valle Verde Dr Unit 211
- 75 N Valle Verde Dr Unit 2121
- 75 N Valle Verde Dr Unit 523
- 75 N Valle Verde Dr Unit 524
- 1802 Alisal Ct
- 2008 Spruce Brook Dr
- 2924 Belmont Dr
- 56 Ancient Hills Ln
- 100 Tanglewood Dr
- 21 Antero Dr
- 1755 Tanner Cir
- 195 Mountainside Dr
- 1942 Buckeye Hill Ct
- 136 Villaggio St
- 11 Desert Dawn Ln
- 44 Willow Wisp Terrace
- 47 Nightshade Ct
- 45 Nightshade Ct
- 1838 Bogey Way
- 42 Willow Wisp Terrace
- 43 Nightshade Ct
- 1836 Bogey Way
- 45 Willow Wisp Terrace
- 1834 Bogey Way
- 43 Willow Wisp Terrace
- 40 Willow Wisp Terrace
- 1851 Bogey Way
- 46 Nightshade Ct
- 41 Nightshade Ct
- 1844 Bogey Way
- 44 Nightshade Ct
- 1853 Bogey Way
- 41 Willow Wisp Terrace
- 42 Nightshade Ct
- 1832 Bogey Way
Your Personal Tour Guide
Ask me questions while you tour the home.