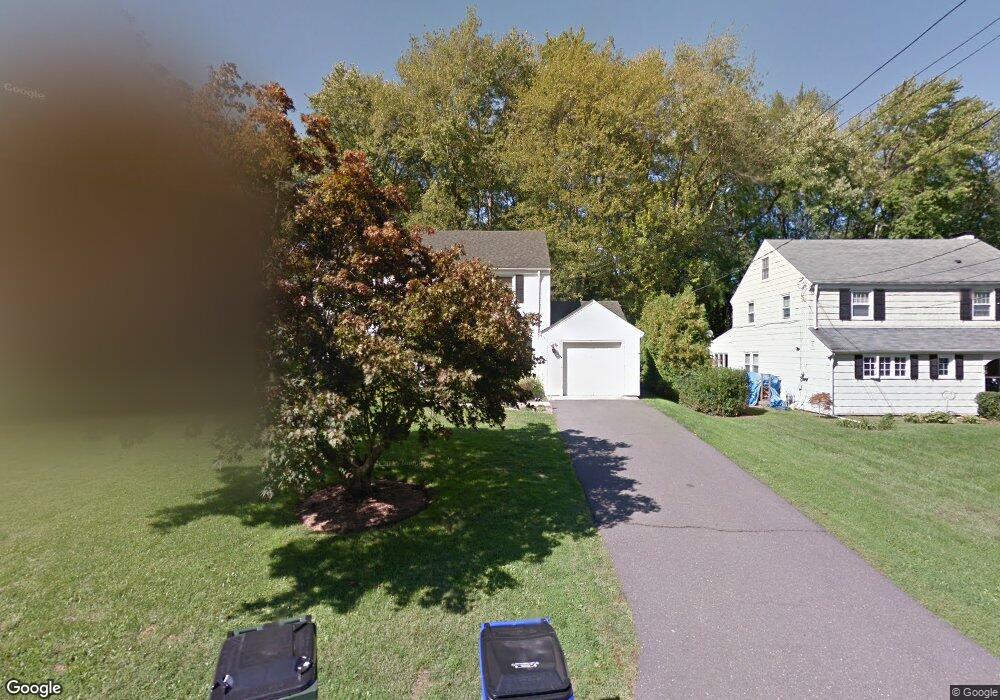
46 Wyndwood Rd West Hartford, CT 06107
Estimated Value: $702,000 - $748,000
3
Beds
3
Baths
2,232
Sq Ft
$323/Sq Ft
Est. Value
About This Home
This home is located at 46 Wyndwood Rd, West Hartford, CT 06107 and is currently estimated at $721,508, approximately $323 per square foot. 46 Wyndwood Rd is a home located in Hartford County with nearby schools including Bugbee School, King Philip Middle School, and Hall High School.
Ownership History
Date
Name
Owned For
Owner Type
Purchase Details
Closed on
Aug 5, 2024
Sold by
Green Kevin G
Bought by
Green T T and Green G
Current Estimated Value
Purchase Details
Closed on
Dec 21, 2011
Sold by
Green Carrie S
Bought by
Green Kevin G
Home Financials for this Owner
Home Financials are based on the most recent Mortgage that was taken out on this home.
Original Mortgage
$248,276
Interest Rate
3.99%
Mortgage Type
Purchase Money Mortgage
Purchase Details
Closed on
Aug 14, 2006
Sold by
Westervelt Kevin K
Bought by
Green Kevin G and Green Carrie S
Purchase Details
Closed on
Sep 21, 2004
Sold by
Lazear Dorothy R
Bought by
Westervelt Kevin K
Create a Home Valuation Report for This Property
The Home Valuation Report is an in-depth analysis detailing your home's value as well as a comparison with similar homes in the area
Home Values in the Area
Average Home Value in this Area
Purchase History
| Date | Buyer | Sale Price | Title Company |
|---|---|---|---|
| Green T T | -- | None Available | |
| Green Kevin G | -- | -- | |
| Green Kevin G | $424,000 | -- | |
| Westervelt Kevin K | $370,000 | -- | |
| Green Kevin G | -- | -- | |
| Green Kevin G | $424,000 | -- | |
| Westervelt Kevin K | $370,000 | -- |
Source: Public Records
Mortgage History
| Date | Status | Borrower | Loan Amount |
|---|---|---|---|
| Previous Owner | Westervelt Kevin K | $120,000 | |
| Previous Owner | Westervelt Kevin K | $248,276 |
Source: Public Records
Tax History Compared to Growth
Tax History
| Year | Tax Paid | Tax Assessment Tax Assessment Total Assessment is a certain percentage of the fair market value that is determined by local assessors to be the total taxable value of land and additions on the property. | Land | Improvement |
|---|---|---|---|---|
| 2025 | $14,827 | $331,100 | $121,170 | $209,930 |
| 2024 | $14,022 | $331,100 | $121,170 | $209,930 |
| 2023 | $13,102 | $320,180 | $121,170 | $199,010 |
| 2022 | $13,025 | $320,180 | $121,170 | $199,010 |
| 2021 | $12,489 | $294,420 | $121,170 | $173,250 |
| 2020 | $11,894 | $284,550 | $113,540 | $171,010 |
| 2019 | $11,894 | $284,550 | $113,540 | $171,010 |
| 2018 | $11,667 | $284,550 | $113,540 | $171,010 |
| 2017 | $11,408 | $277,970 | $113,540 | $164,430 |
| 2016 | $10,994 | $278,250 | $119,000 | $159,250 |
| 2015 | $10,660 | $278,250 | $119,000 | $159,250 |
| 2014 | $10,398 | $278,250 | $119,000 | $159,250 |
Source: Public Records
Map
Nearby Homes
- 223 N Main St
- 132 N Main St
- 183 Loomis Dr Unit 109
- 1196 Trout Brook Dr
- 1268 Trout Brook Dr
- 1272 Trout Brook Dr
- 129 Middlebrook Rd
- 37 W Normandy Dr
- 62 Blue Ridge Ln
- 1294 Trout Brook Dr
- 209 Ballard Dr
- 97 Robin Rd
- 356 Fern St
- 1028 Farmington Ave Unit 1C
- 54 Robin Rd Unit B2
- 105 Ardmore Rd
- 2581 Albany Ave
- 11 High Gate Ln
- 26 Robin Rd Unit 3
- 51 Bretton Rd