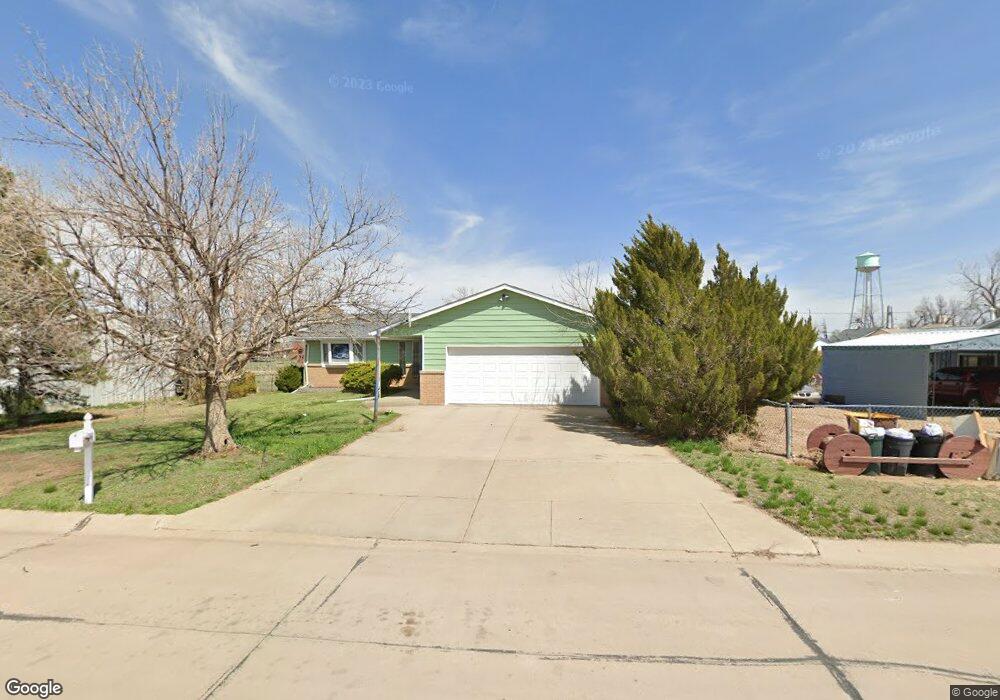
460 2nd St Bennett, CO 80102
Estimated Value: $361,000 - $432,000
3
Beds
2
Baths
1,947
Sq Ft
$207/Sq Ft
Est. Value
About This Home
This home is located at 460 2nd St, Bennett, CO 80102 and is currently estimated at $402,221, approximately $206 per square foot. 460 2nd St is a home located in Adams County with nearby schools including Bennett Elementary School, Bennett Middle School, and Bennett High School.
Ownership History
Date
Name
Owned For
Owner Type
Purchase Details
Closed on
Jan 19, 2017
Sold by
Powell Meghan E
Bought by
Pewell Meghan E and Deutsch Bryan F
Current Estimated Value
Home Financials for this Owner
Home Financials are based on the most recent Mortgage that was taken out on this home.
Original Mortgage
$159,000
Outstanding Balance
$129,897
Interest Rate
4.16%
Mortgage Type
New Conventional
Estimated Equity
$272,324
Purchase Details
Closed on
Oct 31, 2008
Sold by
Secretary Of Housing & Urban Development
Bought by
Powell Meghan E
Purchase Details
Closed on
Oct 31, 2003
Sold by
Wilson Stephanie L and Wilson Jeffrey L
Bought by
Dansby Charles R and Dansby Deborah J
Home Financials for this Owner
Home Financials are based on the most recent Mortgage that was taken out on this home.
Original Mortgage
$192,283
Interest Rate
5.81%
Mortgage Type
Unknown
Purchase Details
Closed on
Apr 22, 1992
Create a Home Valuation Report for This Property
The Home Valuation Report is an in-depth analysis detailing your home's value as well as a comparison with similar homes in the area
Purchase History
| Date | Buyer | Sale Price | Title Company |
|---|---|---|---|
| Pewell Meghan E | -- | None Available | |
| Powell Meghan E | -- | Stewart Title Guarantee Comp | |
| Dansby Charles R | $195,000 | -- | |
| -- | $70,000 | -- |
Source: Public Records
Mortgage History
| Date | Status | Borrower | Loan Amount |
|---|---|---|---|
| Open | Pewell Meghan E | $159,000 | |
| Previous Owner | Dansby Charles R | $192,283 |
Source: Public Records
Tax History
| Year | Tax Paid | Tax Assessment Tax Assessment Total Assessment is a certain percentage of the fair market value that is determined by local assessors to be the total taxable value of land and additions on the property. | Land | Improvement |
|---|---|---|---|---|
| 2025 | $2,169 | $25,020 | $4,760 | $20,260 |
| 2024 | $2,169 | $23,010 | $4,380 | $18,630 |
| 2023 | $2,183 | $29,230 | $4,740 | $24,490 |
| 2022 | $1,730 | $20,080 | $3,680 | $16,400 |
| 2021 | $1,766 | $20,080 | $3,680 | $16,400 |
| 2020 | $1,381 | $16,390 | $3,790 | $12,600 |
| 2019 | $1,418 | $16,390 | $3,790 | $12,600 |
| 2018 | $1,534 | $16,120 | $4,320 | $11,800 |
| 2017 | $1,547 | $16,120 | $4,320 | $11,800 |
| 2016 | $1,259 | $13,590 | $1,830 | $11,760 |
| 2015 | $1,253 | $13,590 | $1,830 | $11,760 |
| 2014 | -- | $11,210 | $1,910 | $9,300 |
Source: Public Records
Map
Nearby Homes
- 440 2nd St
- 490 2nd St
- 475 3rd St
- 455 3rd St
- 215 Washington Ave
- 245 Washington Ave
- 485 3rd St
- 495 2nd St
- 275 Washington Ave
- 500 2nd St
- 425 2nd St
- 425 3rd St
- 295 W Lincoln Ave
- 205 Lincoln Ave
- 510 2nd St
- 525 3rd St
- 220 Washington Ave Unit 12
- 220 Washington Ave Unit 11
- 220 Washington Ave Unit SP 0014
- 440 3rd St
Your Personal Tour Guide
Ask me questions while you tour the home.