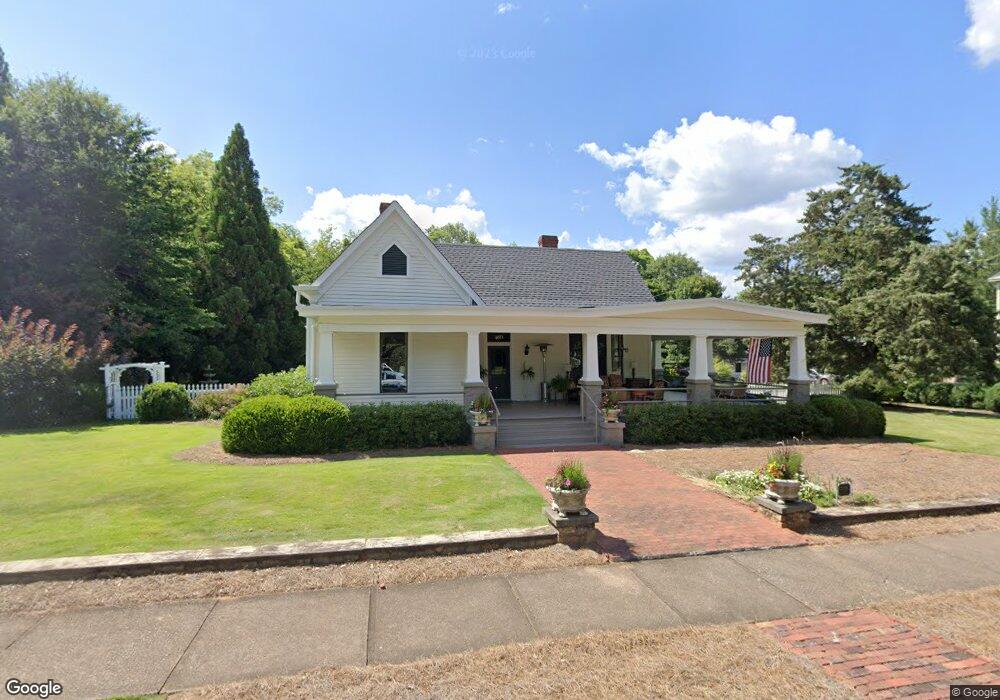
460 Academy St Madison, GA 30650
Estimated Value: $1,436,400
4
Beds
3
Baths
3,261
Sq Ft
$440/Sq Ft
Est. Value
About This Home
This home is located at 460 Academy St, Madison, GA 30650 and is currently estimated at $1,436,400, approximately $440 per square foot. 460 Academy St is a home located in Morgan County with nearby schools including Morgan County Primary School, Morgan County Elementary School, and Morgan County Middle School.
Ownership History
Date
Name
Owned For
Owner Type
Purchase Details
Closed on
Mar 6, 2019
Sold by
Manos William
Bought by
Becker Michael J and Becker Laurie E
Current Estimated Value
Home Financials for this Owner
Home Financials are based on the most recent Mortgage that was taken out on this home.
Original Mortgage
$483,000
Outstanding Balance
$424,639
Interest Rate
4.4%
Mortgage Type
New Conventional
Estimated Equity
$1,011,761
Purchase Details
Closed on
Jul 15, 2008
Sold by
Pap Rocki James
Bought by
Manos William
Home Financials for this Owner
Home Financials are based on the most recent Mortgage that was taken out on this home.
Original Mortgage
$150,000
Interest Rate
6.37%
Mortgage Type
New Conventional
Purchase Details
Closed on
Jun 1, 2001
Sold by
Wacker Frederick
Bought by
Paprocki James E
Purchase Details
Closed on
Jul 12, 1988
Sold by
Hancock Edwin P
Bought by
Wacker Frederick
Create a Home Valuation Report for This Property
The Home Valuation Report is an in-depth analysis detailing your home's value as well as a comparison with similar homes in the area
Home Values in the Area
Average Home Value in this Area
Purchase History
| Date | Buyer | Sale Price | Title Company |
|---|---|---|---|
| Becker Michael J | $805,000 | -- | |
| Manos William | $790,000 | -- | |
| Paprocki James E | $335,000 | -- | |
| Wacker Frederick | $145,000 | -- |
Source: Public Records
Mortgage History
| Date | Status | Borrower | Loan Amount |
|---|---|---|---|
| Open | Becker Michael J | $483,000 | |
| Previous Owner | Manos William | $150,000 |
Source: Public Records
Tax History Compared to Growth
Tax History
| Year | Tax Paid | Tax Assessment Tax Assessment Total Assessment is a certain percentage of the fair market value that is determined by local assessors to be the total taxable value of land and additions on the property. | Land | Improvement |
|---|---|---|---|---|
| 2024 | $9,283 | $340,056 | $52,000 | $288,056 |
| 2023 | $8,776 | $313,172 | $52,000 | $261,172 |
| 2022 | $8,383 | $289,075 | $40,000 | $249,075 |
| 2021 | $8,530 | $283,075 | $34,000 | $249,075 |
| 2020 | $8,601 | $282,654 | $34,000 | $248,654 |
| 2019 | $6,087 | $208,523 | $34,000 | $174,523 |
| 2018 | $5,516 | $187,678 | $34,000 | $153,678 |
| 2017 | $5,546 | $174,320 | $34,000 | $140,320 |
| 2016 | $5,653 | $185,120 | $34,000 | $151,120 |
| 2015 | $5,702 | $184,520 | $34,000 | $150,520 |
| 2014 | -- | $168,840 | $29,600 | $139,240 |
| 2013 | -- | $152,120 | $29,600 | $122,520 |
Source: Public Records
Map
Nearby Homes
- 411 Old Post Rd
- 546 Fourth St
- 724 Hill St
- 617 Dixie Ave
- 665 E Walton St
- 690 Foster Park Ln
- 601 Foster Park Ln
- 855 Jasper St
- 1.19 +/- ACRES Poplar St
- 691 Skyline Dr
- 426 Poplar St
- 221 W Jefferson St
- 1001 Alaina Ave
- 1041 Alaina Ave Unit 69
- 1001 Alaina Ave Unit 71
- 1041 Alaina Ave
- 991 Crawford St
- .78 +/- acres Poplar St
- 1000 Jacob Prickett Ln
- 1291 Spinnaker Rd
- 484 Academy St
- 434 Academy St
- 485 Old Post Rd
- 504 Academy St
- 686 Hill St
- 364A Hill St
- 386 Academy St
- 692 Hill St
- 530 Academy St
- 338 Porter St
- 364 Porter St
- 549 Old Post Rd
- 507 S Main St
- 490 Fourth St
- 0 Old Post Rd Unit 7330597
- 0 Old Post Rd Unit 3223049
- 0 Old Post Rd Unit 8483270
- 0 Old Post Rd Unit 8871652
- 0 Old Post Rd Unit 8669215
- 0 Old Post Rd Unit 8546774