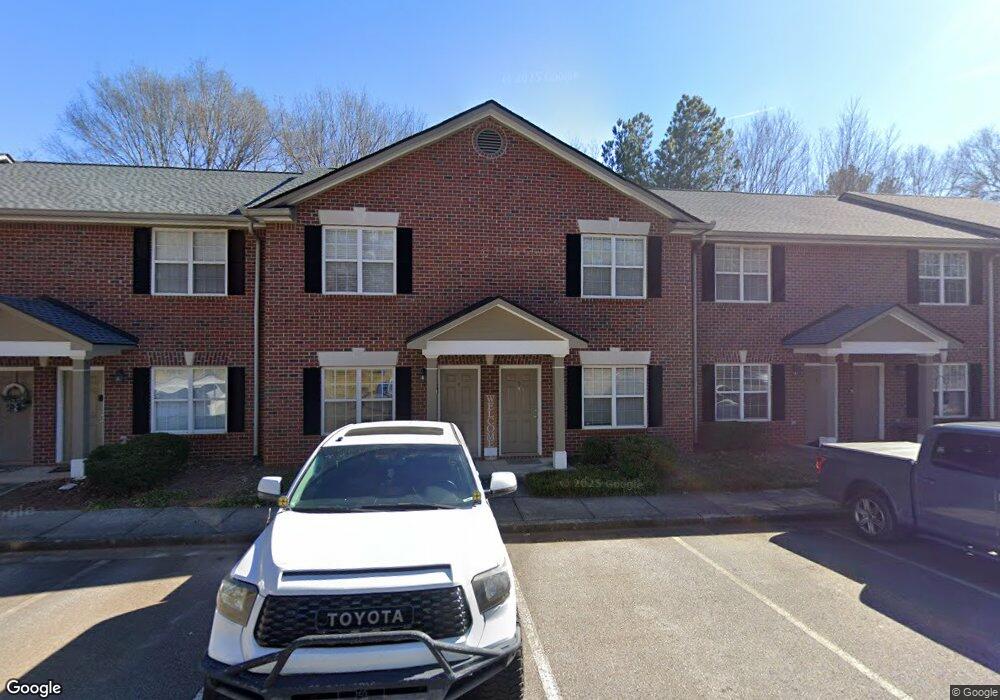
460 Barnett Shoals Rd Unit 8D Athens, GA 30605
Estimated Value: $247,000 - $263,000
2
Beds
3
Baths
1,184
Sq Ft
$214/Sq Ft
Est. Value
About This Home
This home is located at 460 Barnett Shoals Rd Unit 8D, Athens, GA 30605 and is currently estimated at $253,348, approximately $213 per square foot. 460 Barnett Shoals Rd Unit 8D is a home located in Clarke County with nearby schools including Barnett Shoals Elementary School, Hilsman Middle School, and Cedar Shoals High School.
Ownership History
Date
Name
Owned For
Owner Type
Purchase Details
Closed on
Mar 4, 2022
Sold by
Ebert Marla
Bought by
355 Fairview Llc
Current Estimated Value
Purchase Details
Closed on
Jan 29, 2021
Sold by
Shannon Nathan K
Bought by
Ebert Marla
Home Financials for this Owner
Home Financials are based on the most recent Mortgage that was taken out on this home.
Original Mortgage
$148,913
Interest Rate
2.6%
Mortgage Type
New Conventional
Purchase Details
Closed on
May 7, 2007
Sold by
Not Provided
Bought by
Shannon Shannon Nathan K Nathan K and Shannon Dayne A
Home Financials for this Owner
Home Financials are based on the most recent Mortgage that was taken out on this home.
Original Mortgage
$114,872
Interest Rate
6.12%
Mortgage Type
FHA
Purchase Details
Closed on
Jun 25, 2002
Sold by
Stone Creek Condominiums Llc
Bought by
Ferris Mark E and Ferris Gloria P
Create a Home Valuation Report for This Property
The Home Valuation Report is an in-depth analysis detailing your home's value as well as a comparison with similar homes in the area
Home Values in the Area
Average Home Value in this Area
Purchase History
| Date | Buyer | Sale Price | Title Company |
|---|---|---|---|
| 355 Fairview Llc | $220,000 | -- | |
| Ebert Marla | $155,000 | -- | |
| Shannon Shannon Nathan K Nathan K | $116,400 | -- | |
| Ferris Mark E | $106,900 | -- |
Source: Public Records
Mortgage History
| Date | Status | Borrower | Loan Amount |
|---|---|---|---|
| Previous Owner | Ebert Marla | $148,913 | |
| Previous Owner | Shannon Shannon Nathan K Nathan K | $114,872 |
Source: Public Records
Tax History Compared to Growth
Tax History
| Year | Tax Paid | Tax Assessment Tax Assessment Total Assessment is a certain percentage of the fair market value that is determined by local assessors to be the total taxable value of land and additions on the property. | Land | Improvement |
|---|---|---|---|---|
| 2024 | $2,913 | $90,194 | $8,000 | $82,194 |
| 2023 | $2,819 | $83,929 | $8,000 | $75,929 |
| 2022 | $1,659 | $69,050 | $8,000 | $61,050 |
| 2021 | $1,739 | $51,607 | $8,000 | $43,607 |
| 2020 | $1,466 | $43,509 | $8,000 | $35,509 |
| 2019 | $1,433 | $42,220 | $8,000 | $34,220 |
| 2018 | $1,354 | $39,873 | $8,000 | $31,873 |
| 2017 | $1,264 | $37,228 | $8,000 | $29,228 |
| 2016 | $1,184 | $34,873 | $8,000 | $26,873 |
| 2015 | $844 | $34,812 | $8,000 | $26,812 |
| 2014 | $856 | $35,110 | $8,000 | $27,110 |
Source: Public Records
Map
Nearby Homes
- 460 Barnett Shoals Rd Unit C2
- 335 Barnett Shoals Rd
- 355 Barnett Shoals Rd
- 490 Barnett Shoals Rd Unit 820
- 490 Barnett Shoals Rd Unit 130
- 490 Barnett Shoals Rd Unit 406
- 490 Barnett Shoals Rd Unit 919
- 490 Barnett Shoals Rd Unit 819
- 490 Barnett Shoals Rd Unit 134
- 490 Barnett Shoals Rd Unit 536
- 210 Johnson Dr
- 660 Barnett Shoals Rd Unit 213
- 1934 Lexington Rd
- 210 Appleby Dr Unit 225
- 170 Royal Ct
- 1035 Barnett Shoals Rd Unit 1240
- 1995 Lexington Rd
- 460 Barnett Shoals Rd Unit H1
- 460 Barnett Shoals Rd Unit D4
- 460 Barnett Shoals Rd Unit D1
- 460 Barnett Shoals Rd Unit C5
- 460 Barnett Shoals Rd Unit B9
- 460 Barnett Shoals Rd Unit A5
- 460 Barnett Shoals Rd Unit F3
- 460 Barnett Shoals Rd Unit G1
- 460 Barnett Shoals Rd Unit H4
- 460 Barnett Shoals Rd Unit 1D
- 460 Barnett Shoals Rd Unit 6H
- 460 Barnett Shoals Rd Unit 10B
- 460 Barnett Shoals Rd Unit B-3
- 460 Barnett Shoals Rd Unit F6
- 460 Barnett Shoals Rd Unit A6
- 460 Barnett Shoals Rd Unit A-7
- 460 Barnett Shoals Rd Unit 3A
- 460 Barnett Shoals Rd Unit 4E
- 460 Barnett Shoals Rd Unit C6
- 460 Barnett Shoals Rd Unit A4