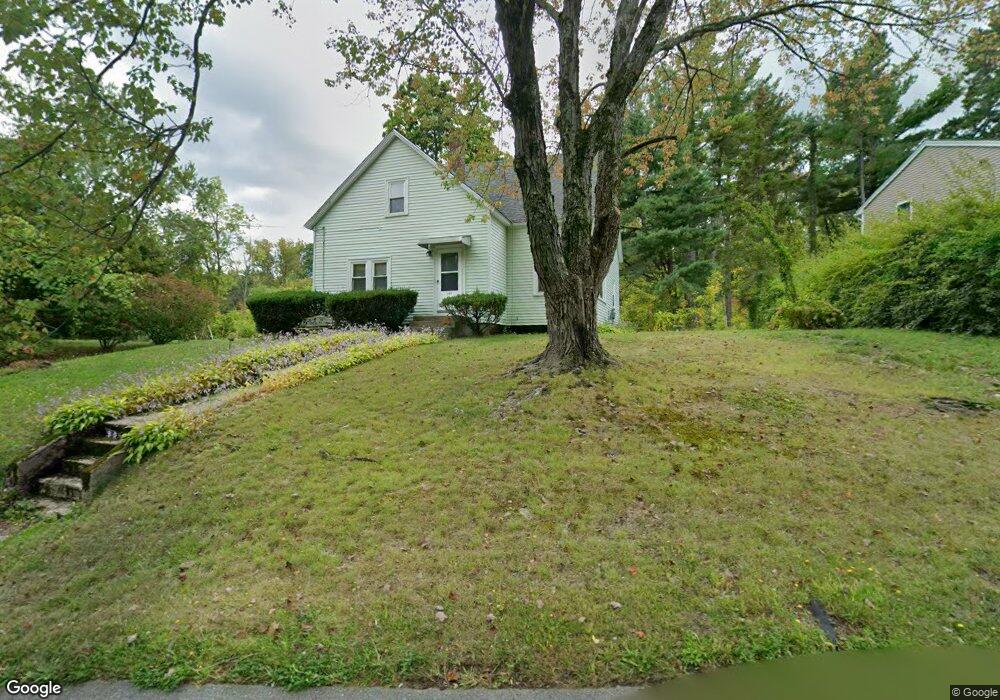
460 Canton St Fitchburg, MA 01420
South Fitchburg NeighborhoodEstimated Value: $415,000 - $480,000
4
Beds
2
Baths
1,748
Sq Ft
$252/Sq Ft
Est. Value
About This Home
This home is located at 460 Canton St, Fitchburg, MA 01420 and is currently estimated at $439,848, approximately $251 per square foot. 460 Canton St is a home located in Worcester County with nearby schools including South Street Elementary School, Reingold Elementary School, and Crocker Elementary School.
Ownership History
Date
Name
Owned For
Owner Type
Purchase Details
Closed on
Feb 17, 2011
Sold by
Bellabarba Louis and Bellabarba Jeanne C
Bought by
Seney Stephen
Current Estimated Value
Purchase Details
Closed on
Oct 7, 2010
Sold by
Gagnon Guy A and Gagnon Norma
Bought by
Peel Michelle Ann and Bellabarba Louis
Purchase Details
Closed on
Nov 30, 1990
Sold by
Gagnon Arthur J
Bought by
Peel Michelle Ann
Create a Home Valuation Report for This Property
The Home Valuation Report is an in-depth analysis detailing your home's value as well as a comparison with similar homes in the area
Home Values in the Area
Average Home Value in this Area
Purchase History
| Date | Buyer | Sale Price | Title Company |
|---|---|---|---|
| Seney Stephen | $159,900 | -- | |
| Peel Michelle Ann | $40,000 | -- | |
| Peel Michelle Ann | $100,000 | -- | |
| Peel Michelle Ann | $100,000 | -- |
Source: Public Records
Mortgage History
| Date | Status | Borrower | Loan Amount |
|---|---|---|---|
| Open | Peel Michelle Ann | $126,400 |
Source: Public Records
Tax History Compared to Growth
Tax History
| Year | Tax Paid | Tax Assessment Tax Assessment Total Assessment is a certain percentage of the fair market value that is determined by local assessors to be the total taxable value of land and additions on the property. | Land | Improvement |
|---|---|---|---|---|
| 2025 | $45 | $334,700 | $100,300 | $234,400 |
| 2024 | $4,310 | $291,000 | $65,700 | $225,300 |
| 2023 | $4,287 | $267,600 | $56,500 | $211,100 |
| 2022 | $3,996 | $226,900 | $47,300 | $179,600 |
| 2021 | $3,561 | $187,100 | $34,100 | $153,000 |
| 2020 | $3,386 | $171,800 | $31,500 | $140,300 |
| 2019 | $3,301 | $161,100 | $44,600 | $116,500 |
| 2018 | $10,679 | $143,300 | $42,000 | $101,300 |
| 2017 | $2,873 | $133,700 | $42,000 | $91,700 |
| 2016 | $2,728 | $128,500 | $38,100 | $90,400 |
| 2015 | $2,616 | $126,500 | $36,800 | $89,700 |
| 2014 | $2,507 | $126,400 | $36,800 | $89,600 |
Source: Public Records
Map
Nearby Homes
- 31 Bemis Rd
- 35 Bemis Rd
- 2 Arden Mills Way Unit 2210
- 1220 Water St
- 20 Pleasantview Ave
- 156 Belmont St
- 1295 Water St
- 43 Saint Anthony St
- 19 Mount Carmel St
- 505 Old St S
- 535 South St Unit 4-2A
- 535 South St Unit 14-2A
- 55 Canton St
- 55 Smith St
- 62 Hancock St
- 29 Bamford Ave
- 15 Clyde St
- 20 Clyde St
- 20 Oregon Ave
- 0 Summer St