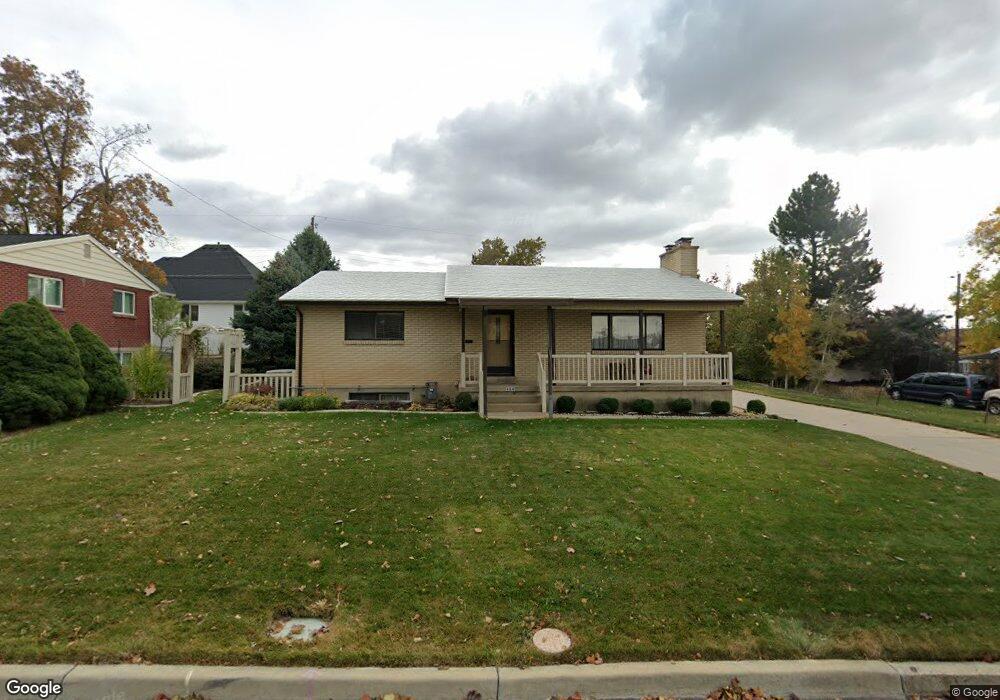
460 E 1000 N Bountiful, UT 84010
Estimated Value: $507,000 - $560,000
4
Beds
2
Baths
1,161
Sq Ft
$455/Sq Ft
Est. Value
About This Home
This home is located at 460 E 1000 N, Bountiful, UT 84010 and is currently estimated at $527,900, approximately $454 per square foot. 460 E 1000 N is a home located in Davis County with nearby schools including Tolman School, Bountiful Junior High School, and Viewmont High School.
Ownership History
Date
Name
Owned For
Owner Type
Purchase Details
Closed on
Jul 8, 2024
Sold by
Barton Reynold J and Barton Nancy L
Bought by
Reynold And Nancy Barton Living Trust and Barton
Current Estimated Value
Purchase Details
Closed on
Apr 20, 2006
Sold by
King Karen
Bought by
Austin Bill & Kary Enterprises Llc
Purchase Details
Closed on
Jun 18, 2001
Sold by
Paget Ralph Roy
Bought by
Barton Reynold J and Barton Nancy L
Home Financials for this Owner
Home Financials are based on the most recent Mortgage that was taken out on this home.
Original Mortgage
$129,200
Interest Rate
7.14%
Create a Home Valuation Report for This Property
The Home Valuation Report is an in-depth analysis detailing your home's value as well as a comparison with similar homes in the area
Purchase History
| Date | Buyer | Sale Price | Title Company |
|---|---|---|---|
| Reynold And Nancy Barton Living Trust | -- | None Listed On Document | |
| Austin Bill & Kary Enterprises Llc | -- | 1St Natl Title Ins Agency | |
| Barton Reynold J | -- | Equity Title Agency |
Source: Public Records
Mortgage History
| Date | Status | Borrower | Loan Amount |
|---|---|---|---|
| Previous Owner | Barton Reynold J | $129,200 |
Source: Public Records
Tax History
| Year | Tax Paid | Tax Assessment Tax Assessment Total Assessment is a certain percentage of the fair market value that is determined by local assessors to be the total taxable value of land and additions on the property. | Land | Improvement |
|---|---|---|---|---|
| 2025 | $2,875 | $257,950 | $134,796 | $123,154 |
| 2024 | $2,707 | $252,450 | $124,267 | $128,183 |
| 2023 | $2,599 | $440,000 | $225,503 | $214,497 |
| 2022 | $2,752 | $256,300 | $120,104 | $136,196 |
| 2021 | $2,346 | $336,000 | $178,525 | $157,475 |
| 2020 | $2,097 | $298,000 | $162,553 | $135,447 |
| 2019 | $2,143 | $298,000 | $159,714 | $138,286 |
| 2018 | $1,985 | $271,000 | $148,421 | $122,579 |
| 2016 | $1,735 | $128,370 | $48,286 | $80,084 |
| 2015 | $1,699 | $118,635 | $48,286 | $70,349 |
| 2014 | $1,665 | $119,666 | $48,286 | $71,380 |
| 2013 | -- | $114,656 | $43,945 | $70,711 |
Source: Public Records
Map
Nearby Homes
- 662 E 1200 N
- 453 N 400 E Unit 7-D
- 345 N 400 E
- 975 E 1050 N
- 610 E Pages Ln
- 1023 E 800 N
- 1420 N Main St
- 683 E 100 N
- 1105 E 600 N
- 967 S Courtyard Ln
- 908 Northern Hills Dr Unit 3
- 49 E 200 N Unit 4
- 41 E 200 N Unit 6
- 933 Northern Hills Cir
- 55 E 200 N Unit 2
- 106 W 700 N
- 51 E 200 N Unit 3
- 256 N Main St
- 252 N Main St
- 254 N Main St
Your Personal Tour Guide
Ask me questions while you tour the home.