Estimated Value: $256,332 - $327,000
Studio
--
Bath
820
Sq Ft
$358/Sq Ft
Est. Value
About This Home
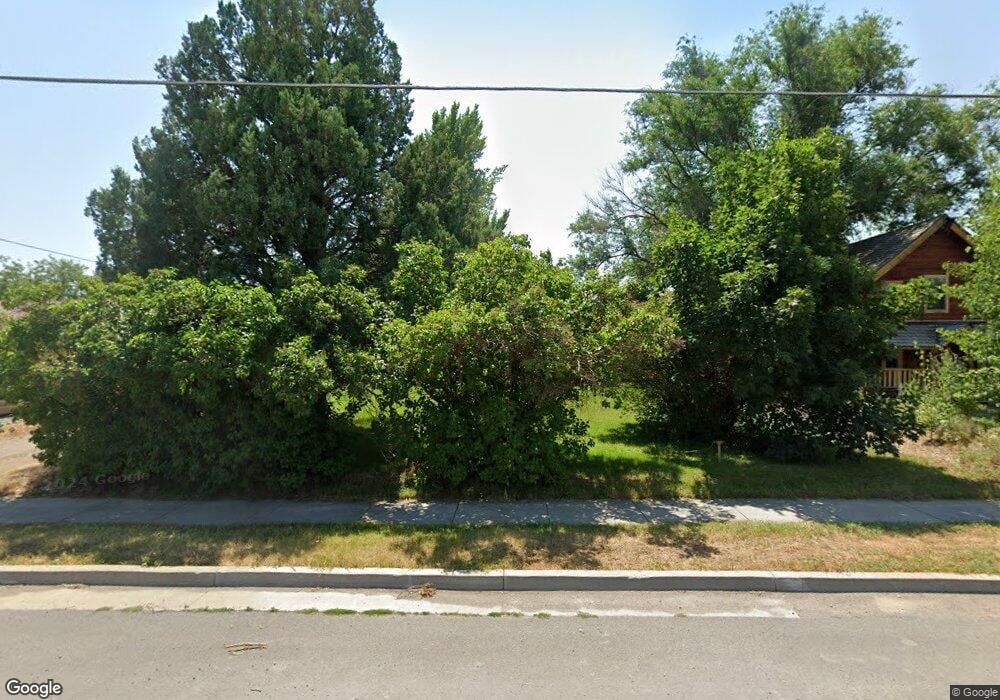
This home is located at 460 E 300 S, Hyrum, UT 84319 and is currently estimated at $293,583, approximately $358 per square foot. 460 E 300 S is a home located in Cache County with nearby schools including Lincoln School, South Cache Middle School, and Mountain Crest High School.
Ownership History
Date
Name
Owned For
Owner Type
Purchase Details
Closed on
Apr 14, 2021
Sold by
Saunders David R and Saunders Margaret
Bought by
Saunders David R and Saunders Margaret A
Current Estimated Value
Purchase Details
Closed on
Aug 11, 2011
Sold by
Saunders Michael David
Bought by
Saunders David R and Saunders Margaret
Purchase Details
Closed on
Jun 16, 2009
Sold by
Wiberg Jared M
Bought by
Saunders Michael David
Purchase Details
Closed on
May 1, 2007
Sold by
Wiberg Maurice C and Wiberg Linda P
Bought by
Wiberg Jared M
Home Financials for this Owner
Home Financials are based on the most recent Mortgage that was taken out on this home.
Original Mortgage
$49,600
Interest Rate
6.15%
Mortgage Type
New Conventional
Create a Home Valuation Report for This Property
The Home Valuation Report is an in-depth analysis detailing your home's value as well as a comparison with similar homes in the area
Home Values in the Area
Average Home Value in this Area
Purchase History
| Date | Buyer | Sale Price | Title Company |
|---|---|---|---|
| Saunders David R | -- | None Available | |
| Saunders David R | -- | Cache Title Company | |
| Saunders Michael David | -- | Advanced Title | |
| Wiberg Jared M | -- | Northern Title Company | |
| Wiberg Maurice C | -- | Northern Title Company |
Source: Public Records
Mortgage History
| Date | Status | Borrower | Loan Amount |
|---|---|---|---|
| Previous Owner | Wiberg Jared M | $49,600 |
Source: Public Records
Tax History
| Year | Tax Paid | Tax Assessment Tax Assessment Total Assessment is a certain percentage of the fair market value that is determined by local assessors to be the total taxable value of land and additions on the property. | Land | Improvement |
|---|---|---|---|---|
| 2025 | $906 | $130,035 | $0 | $0 |
| 2024 | $970 | $130,055 | $0 | $0 |
| 2023 | $932 | $119,515 | $0 | $0 |
| 2022 | $943 | $115,825 | $0 | $0 |
| 2021 | $893 | $169,008 | $65,050 | $103,958 |
| 2020 | $816 | $145,018 | $65,050 | $79,968 |
| 2019 | $730 | $121,968 | $42,000 | $79,968 |
| 2018 | $702 | $113,400 | $42,000 | $71,400 |
| 2017 | $615 | $51,535 | $0 | $0 |
| 2016 | $629 | $51,535 | $0 | $0 |
| 2015 | $630 | $51,535 | $0 | $0 |
| 2014 | $616 | $51,535 | $0 | $0 |
| 2013 | -- | $51,535 | $0 | $0 |
Source: Public Records
Map
Nearby Homes
Your Personal Tour Guide
Ask me questions while you tour the home.