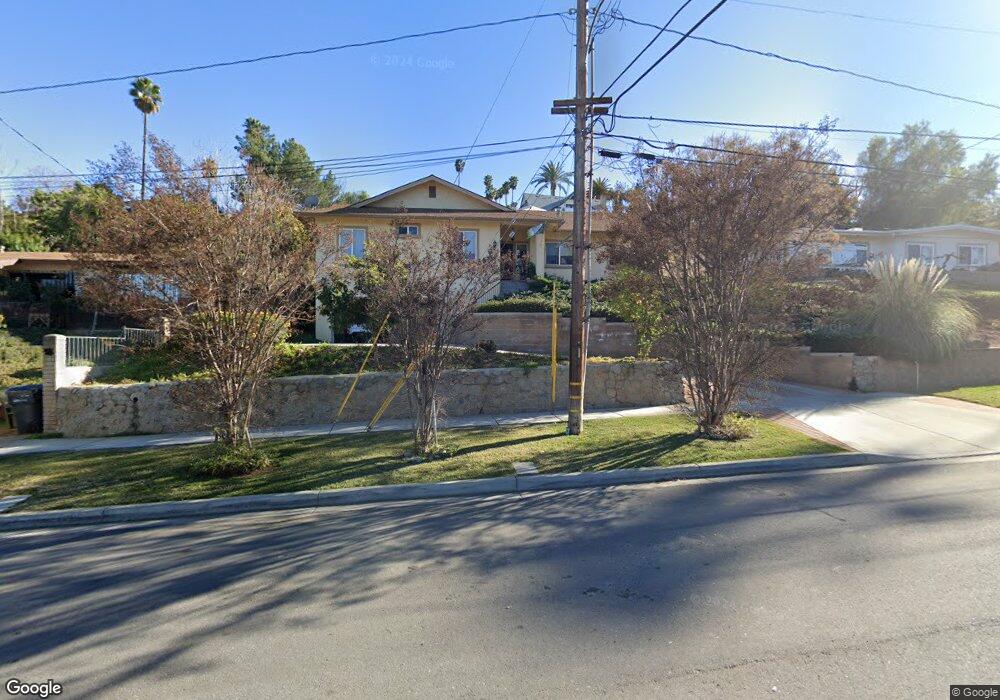
460 E Crescent Ave Redlands, CA 92373
South Redlands NeighborhoodEstimated Value: $777,941 - $921,000
3
Beds
3
Baths
2,246
Sq Ft
$374/Sq Ft
Est. Value
About This Home
This home is located at 460 E Crescent Ave, Redlands, CA 92373 and is currently estimated at $840,735, approximately $374 per square foot. 460 E Crescent Ave is a home located in San Bernardino County with nearby schools including Kimberly Elementary School, Moore Middle School, and Redlands Senior High School.
Ownership History
Date
Name
Owned For
Owner Type
Purchase Details
Closed on
Sep 7, 2010
Sold by
Bart Leon Inc
Bought by
Barto Lindsay M
Current Estimated Value
Purchase Details
Closed on
Jul 14, 2010
Sold by
Bart Leon Inc
Bought by
Oconnor Bonnie Lynn
Purchase Details
Closed on
May 20, 2005
Sold by
Eghbal Morteza
Bought by
Bart Leon Inc
Purchase Details
Closed on
Jun 17, 2002
Sold by
Chesus Mary
Bought by
Eghbal Morteza and The East Crescent Avenue Trust
Create a Home Valuation Report for This Property
The Home Valuation Report is an in-depth analysis detailing your home's value as well as a comparison with similar homes in the area
Home Values in the Area
Average Home Value in this Area
Purchase History
| Date | Buyer | Sale Price | Title Company |
|---|---|---|---|
| Barto Lindsay M | -- | None Available | |
| Oconnor Bonnie Lynn | -- | None Available | |
| Bart Leon Inc | $145,000 | Commonwealth Title | |
| Eghbal Morteza | $30,000 | Stewart Title |
Source: Public Records
Tax History
| Year | Tax Paid | Tax Assessment Tax Assessment Total Assessment is a certain percentage of the fair market value that is determined by local assessors to be the total taxable value of land and additions on the property. | Land | Improvement |
|---|---|---|---|---|
| 2025 | $5,889 | $480,444 | $121,712 | $358,732 |
| 2024 | $5,496 | $471,023 | $119,325 | $351,698 |
| 2023 | $5,489 | $461,787 | $116,985 | $344,802 |
| 2022 | $5,407 | $452,732 | $114,691 | $338,041 |
| 2021 | $5,505 | $443,855 | $112,442 | $331,413 |
| 2020 | $5,422 | $439,304 | $111,289 | $328,015 |
| 2019 | $5,268 | $430,690 | $109,107 | $321,583 |
| 2018 | $5,135 | $422,245 | $106,968 | $315,277 |
| 2017 | $5,090 | $413,966 | $104,871 | $309,095 |
| 2016 | $5,031 | $405,849 | $102,815 | $303,034 |
| 2015 | $4,992 | $399,753 | $101,271 | $298,482 |
| 2014 | $4,900 | $391,922 | $99,287 | $292,635 |
Source: Public Records
Map
Nearby Homes
- 261 E Crescent Ave
- 1055 Roosevelt Rd
- 412 Phlox Ct
- 0 Campbell Ave
- 11 E Crescent Ave
- 116 Franklin Ave
- 356 Campbell Ave
- 120 Franklin Ave
- 1370 Oak St
- 635 E Palm Ave
- 709 Bermuda Dr
- 0 W Palm Ave Unit IV25244005
- 1049 Evergreen Ct
- 643 Cypress Cir
- 1089 Ardmore Cir
- 135 E Cypress Ave
- 1377 Knoll Rd
- 209 Anita Ct
- 1032 Ardmore Cir
- 225 Sunset Dr
- 456 E Crescent Ave
- 466 E Crescent Ave
- 450 E Crescent Ave
- 7 Bow c St
- 470 E Crescent Ave
- 440 E Crescent Ave
- 457 E Crescent Ave
- 15 Bow c St
- 445 E Crescent Ave
- 5 Bow c St
- 432 E Crescent Ave
- 458 E Highland Ave
- 435 E Crescent Ave
- 444 E Highland Ave
- 9 Bow c St
- 440 E Highland Ave
- 427 E Crescent Ave
- 308 E Crescent Ave
- 430 E Highland Ave
- 233 Grand View Dr
Your Personal Tour Guide
Ask me questions while you tour the home.