Estimated Value: $1,203,000 - $1,315,000
3
Beds
2
Baths
1,980
Sq Ft
$647/Sq Ft
Est. Value
About This Home
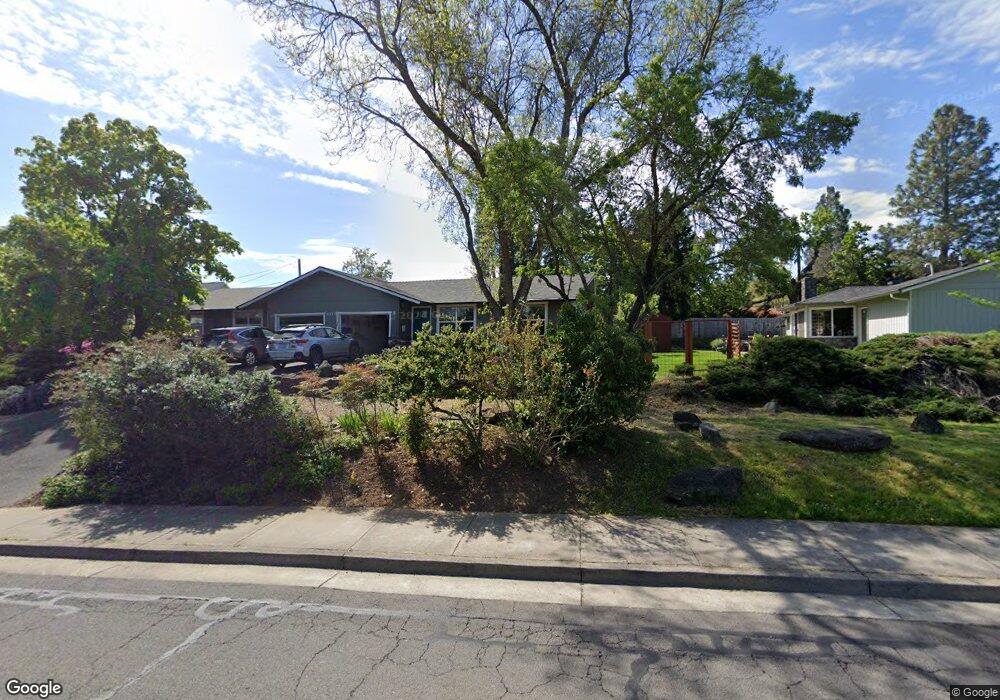
This home is located at 460 G St, Jacksonville, OR 97530 and is currently estimated at $1,280,554, approximately $646 per square foot. 460 G St is a home located in Jackson County with nearby schools including Jacksonville Elementary School, McLoughlin Middle School, and South Medford High School.
Ownership History
Date
Name
Owned For
Owner Type
Purchase Details
Closed on
Nov 10, 2021
Sold by
Carpenter John R and Carpenter Susanna V
Bought by
White Frederick R and White Jamie R
Current Estimated Value
Home Financials for this Owner
Home Financials are based on the most recent Mortgage that was taken out on this home.
Original Mortgage
$1,008,000
Outstanding Balance
$918,087
Interest Rate
3.01%
Mortgage Type
New Conventional
Estimated Equity
$362,467
Purchase Details
Closed on
Oct 18, 2019
Sold by
Zitzner Todd and Zitzner Beth
Bought by
Carpenter John R and Carpenter Susanna V
Home Financials for this Owner
Home Financials are based on the most recent Mortgage that was taken out on this home.
Original Mortgage
$849,600
Interest Rate
3.4%
Mortgage Type
New Conventional
Purchase Details
Closed on
Jul 29, 2002
Sold by
Thornton Robert Gene
Bought by
Zitzner Todd and Zitzner Beth
Create a Home Valuation Report for This Property
The Home Valuation Report is an in-depth analysis detailing your home's value as well as a comparison with similar homes in the area
Home Values in the Area
Average Home Value in this Area
Purchase History
| Date | Buyer | Sale Price | Title Company |
|---|---|---|---|
| White Frederick R | $1,260,000 | First American | |
| White Frederick R | $1,260,000 | First American | |
| Carpenter John R | $944,000 | Amerititle | |
| Carpenter John R | $944,000 | Amerititle | |
| Zitzner Todd | $263,000 | Jackson County Title | |
| Zitzner Todd | $263,000 | Jackson County Title |
Source: Public Records
Mortgage History
| Date | Status | Borrower | Loan Amount |
|---|---|---|---|
| Open | White Frederick R | $1,008,000 | |
| Previous Owner | Carpenter John R | $849,600 |
Source: Public Records
Tax History
| Year | Tax Paid | Tax Assessment Tax Assessment Total Assessment is a certain percentage of the fair market value that is determined by local assessors to be the total taxable value of land and additions on the property. | Land | Improvement |
|---|---|---|---|---|
| 2026 | $9,235 | $812,790 | -- | -- |
| 2025 | $9,228 | $789,120 | $281,780 | $507,340 |
| 2024 | $9,228 | $766,140 | $273,580 | $492,560 |
| 2023 | $8,555 | $715,180 | $265,620 | $449,560 |
| 2022 | $8,355 | $715,180 | $265,620 | $449,560 |
| 2021 | $8,151 | $694,350 | $257,890 | $436,460 |
| 2020 | $7,965 | $674,130 | $250,380 | $423,750 |
| 2019 | $7,531 | $614,310 | $236,010 | $378,300 |
| 2018 | $7,346 | $515,050 | $229,140 | $285,910 |
| 2017 | $6,249 | $515,050 | $229,140 | $285,910 |
| 2016 | $4,388 | $345,550 | $216,000 | $129,550 |
| 2015 | $5,031 | $413,810 | $216,000 | $197,810 |
| 2014 | $4,962 | $390,060 | $203,600 | $186,460 |
Source: Public Records
Map
Nearby Homes
- 110 Mccully Ln
- 410 N 8th St
- 620 E D St
- 280 7th St
- 545 E C St
- 300 Shafer Ln Unit I2
- 415 E C St
- 110 Taylor St
- 215 Jackson Creek Dr
- 440 N 4th St Unit 104
- 175 E E St
- 245 Jackson Creek Dr
- 795 Bybee Dr
- 1055 N 5th St Unit 15
- 1055 N 5th St Unit 43
- 1055 N 5th St Unit 110
- 1055 N 5th St Unit 152
- 560 Woodberry Ln
- 330 E Fir St
- 825 Royal Ln
Your Personal Tour Guide
Ask me questions while you tour the home.