Estimated Value: $151,000 - $193,000
3
Beds
2
Baths
900
Sq Ft
$189/Sq Ft
Est. Value
About This Home
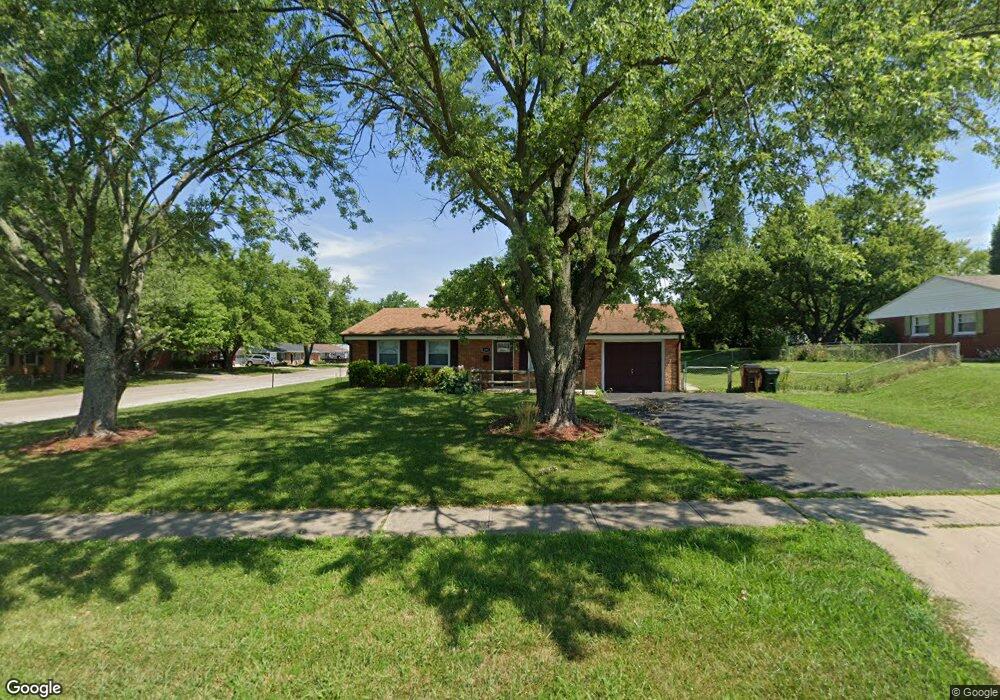
This home is located at 460 Ledbetter Rd, Xenia, OH 45385 and is currently estimated at $170,263, approximately $189 per square foot. 460 Ledbetter Rd is a home located in Greene County with nearby schools including Xenia High School, Summit Academy Community School for Alternative Learners - Xenia, and Legacy Christian Academy.
Ownership History
Date
Name
Owned For
Owner Type
Purchase Details
Closed on
Jul 30, 2021
Sold by
King David and King June
Bought by
Gary L Wallman Llc
Current Estimated Value
Purchase Details
Closed on
May 13, 2010
Sold by
Hsbc Bank Usa Na
Bought by
King David
Home Financials for this Owner
Home Financials are based on the most recent Mortgage that was taken out on this home.
Original Mortgage
$68,083
Interest Rate
4.63%
Mortgage Type
FHA
Purchase Details
Closed on
Mar 12, 2010
Sold by
Mccoy Melinda
Bought by
Hsbc Bank Usa Na
Purchase Details
Closed on
Nov 28, 2005
Sold by
Hagler Kathryn K
Bought by
Mccoy Melinda
Home Financials for this Owner
Home Financials are based on the most recent Mortgage that was taken out on this home.
Original Mortgage
$70,000
Interest Rate
8.87%
Mortgage Type
Fannie Mae Freddie Mac
Create a Home Valuation Report for This Property
The Home Valuation Report is an in-depth analysis detailing your home's value as well as a comparison with similar homes in the area
Home Values in the Area
Average Home Value in this Area
Purchase History
| Date | Buyer | Sale Price | Title Company |
|---|---|---|---|
| Gary L Wallman Llc | $17,000 | None Listed On Document | |
| King David | $69,000 | None Available | |
| Hsbc Bank Usa Na | $60,000 | None Available | |
| Mccoy Melinda | $90,000 | Vantage Land Title Inc |
Source: Public Records
Mortgage History
| Date | Status | Borrower | Loan Amount |
|---|---|---|---|
| Previous Owner | King David | $68,083 | |
| Previous Owner | Mccoy Melinda | $70,000 |
Source: Public Records
Tax History Compared to Growth
Tax History
| Year | Tax Paid | Tax Assessment Tax Assessment Total Assessment is a certain percentage of the fair market value that is determined by local assessors to be the total taxable value of land and additions on the property. | Land | Improvement |
|---|---|---|---|---|
| 2024 | $1,796 | $41,980 | $9,000 | $32,980 |
| 2023 | $1,796 | $41,980 | $9,000 | $32,980 |
| 2022 | $1,539 | $30,680 | $6,420 | $24,260 |
| 2021 | $1,560 | $30,680 | $6,420 | $24,260 |
| 2020 | $1,494 | $30,680 | $6,420 | $24,260 |
| 2019 | $1,394 | $26,940 | $4,180 | $22,760 |
| 2018 | $1,399 | $26,940 | $4,180 | $22,760 |
| 2017 | $1,290 | $26,940 | $4,180 | $22,760 |
| 2016 | $1,291 | $24,380 | $4,180 | $20,200 |
| 2015 | $1,294 | $24,380 | $4,180 | $20,200 |
| 2014 | $1,239 | $24,380 | $4,180 | $20,200 |
Source: Public Records
Map
Nearby Homes
- 523 Newport Rd
- 104 Ledbetter Rd
- 733 State Route 380
- 55 Lake St
- 46 Lake St
- 847 S Detroit St
- 633 Xenia Ave
- 453 Walnut St
- 260 Pocahontas St
- 1208 Bellbrook Ave
- 1272 Bellbrook Ave
- 293 S Miami Ave
- 979 Mcdowell St
- 305-325 Bellbrook Ave
- 148 Home Ave
- 400 S Detroit St
- 910 Wright Ave
- 222 Washington St
- 1778 Arapaho Dr
- 98 W 3rd St
- 791 Mount Vernon Dr
- 442 Ledbetter Rd
- 428 Ledbetter Rd
- 469 Bedford Ave
- 492 Ledbetter Rd
- 792 Mount Vernon Dr
- 439 Bedford Ave
- 416 Ledbetter Rd
- 780 Mount Vernon Dr
- 427 Bedford Ave
- 766 Mount Vernon Dr
- 402 Ledbetter Rd
- 747 Mount Vernon Dr
- 456 Bedford Ave
- 413 Bedford Ave
- 752 Mount Vernon Dr
- 1176 Salem Ln
- 388 Ledbetter Rd
- 550 Ledbetter Rd
- 399 Bedford Ave