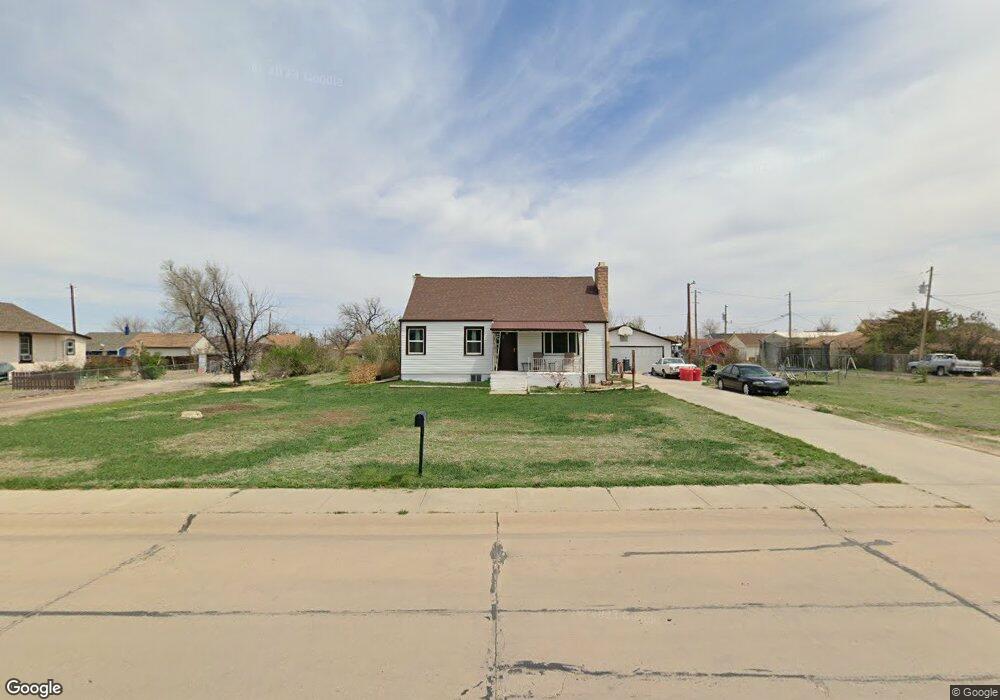
460 N 5th St Bennett, CO 80102
Estimated Value: $367,325 - $432,000
3
Beds
1
Bath
1,082
Sq Ft
$368/Sq Ft
Est. Value
About This Home
This home is located at 460 N 5th St, Bennett, CO 80102 and is currently estimated at $397,831, approximately $367 per square foot. 460 N 5th St is a home with nearby schools including Bennett Elementary School, Bennett Middle School, and Bennett High School.
Ownership History
Date
Name
Owned For
Owner Type
Purchase Details
Closed on
Jan 30, 2025
Sold by
Bang Edward G
Bought by
Ed Bang Trust
Current Estimated Value
Purchase Details
Closed on
Apr 19, 2014
Sold by
Bang Nancy C
Bought by
Bang Edward G
Purchase Details
Closed on
Jun 3, 2009
Sold by
Mercy Housing Southwest
Bought by
Johnson David R
Home Financials for this Owner
Home Financials are based on the most recent Mortgage that was taken out on this home.
Original Mortgage
$82,674
Interest Rate
4.97%
Mortgage Type
FHA
Create a Home Valuation Report for This Property
The Home Valuation Report is an in-depth analysis detailing your home's value as well as a comparison with similar homes in the area
Purchase History
| Date | Buyer | Sale Price | Title Company |
|---|---|---|---|
| Ed Bang Trust | -- | None Listed On Document | |
| Bang Edward G | -- | None Available | |
| Johnson David R | $84,200 | None Available |
Source: Public Records
Mortgage History
| Date | Status | Borrower | Loan Amount |
|---|---|---|---|
| Previous Owner | Johnson David R | $82,674 |
Source: Public Records
Tax History
| Year | Tax Paid | Tax Assessment Tax Assessment Total Assessment is a certain percentage of the fair market value that is determined by local assessors to be the total taxable value of land and additions on the property. | Land | Improvement |
|---|---|---|---|---|
| 2025 | $1,369 | $26,320 | $4,760 | $21,560 |
| 2024 | $1,369 | $24,190 | $4,380 | $19,810 |
| 2023 | $1,378 | $26,590 | $4,740 | $21,850 |
| 2022 | $1,246 | $21,410 | $3,680 | $17,730 |
| 2021 | $1,272 | $21,410 | $3,680 | $17,730 |
| 2020 | $1,126 | $20,520 | $3,790 | $16,730 |
| 2019 | $1,157 | $20,520 | $3,790 | $16,730 |
| 2018 | $1,057 | $18,310 | $4,320 | $13,990 |
| 2017 | $1,066 | $18,310 | $4,320 | $13,990 |
| 2016 | $479 | $10,340 | $1,830 | $8,510 |
| 2015 | $477 | $5,170 | $920 | $4,250 |
| 2014 | -- | $5,170 | $960 | $4,210 |
Source: Public Records
Map
Nearby Homes
Your Personal Tour Guide
Ask me questions while you tour the home.