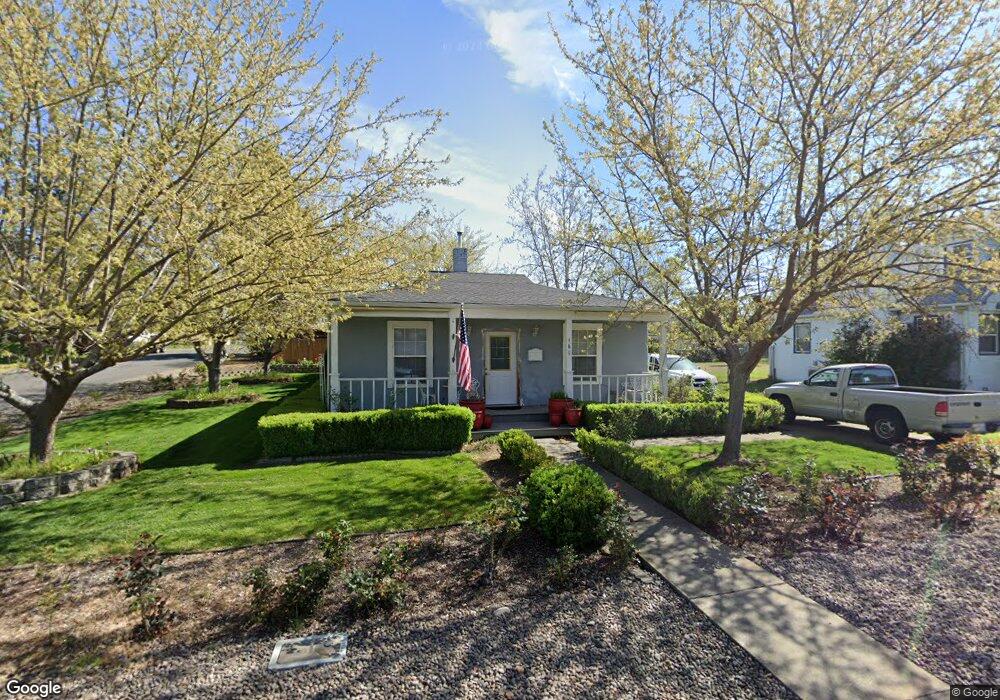
460 N 5th St Central Point, OR 97502
Estimated Value: $260,350 - $289,000
2
Beds
1
Bath
966
Sq Ft
$289/Sq Ft
Est. Value
About This Home
This home is located at 460 N 5th St, Central Point, OR 97502 and is currently estimated at $278,838, approximately $288 per square foot. 460 N 5th St is a home located in Jackson County with nearby schools including Jewett Elementary School, Scenic Middle School, and Crater High School.
Ownership History
Date
Name
Owned For
Owner Type
Purchase Details
Closed on
Dec 30, 2005
Sold by
Owen Sharron A
Bought by
Owen Sharon A and Stafford Lester W
Current Estimated Value
Purchase Details
Closed on
Nov 29, 1999
Sold by
Sesulka Susan A
Bought by
Owen Sharon A
Home Financials for this Owner
Home Financials are based on the most recent Mortgage that was taken out on this home.
Original Mortgage
$60,000
Outstanding Balance
$18,755
Interest Rate
7.84%
Estimated Equity
$260,084
Create a Home Valuation Report for This Property
The Home Valuation Report is an in-depth analysis detailing your home's value as well as a comparison with similar homes in the area
Home Values in the Area
Average Home Value in this Area
Purchase History
| Date | Buyer | Sale Price | Title Company |
|---|---|---|---|
| Owen Sharon A | -- | -- | |
| Owen Sharon A | $8,888 | Amerititle |
Source: Public Records
Mortgage History
| Date | Status | Borrower | Loan Amount |
|---|---|---|---|
| Open | Owen Sharon A | $60,000 |
Source: Public Records
Tax History Compared to Growth
Tax History
| Year | Tax Paid | Tax Assessment Tax Assessment Total Assessment is a certain percentage of the fair market value that is determined by local assessors to be the total taxable value of land and additions on the property. | Land | Improvement |
|---|---|---|---|---|
| 2025 | $1,967 | $118,290 | $58,660 | $59,630 |
| 2024 | $1,967 | $114,850 | $56,960 | $57,890 |
| 2023 | $1,903 | $111,510 | $55,310 | $56,200 |
| 2022 | $1,859 | $111,510 | $55,310 | $56,200 |
| 2021 | $1,806 | $108,270 | $53,710 | $54,560 |
| 2020 | $1,753 | $105,120 | $52,150 | $52,970 |
| 2019 | $1,710 | $99,090 | $49,160 | $49,930 |
| 2018 | $1,658 | $96,210 | $47,730 | $48,480 |
| 2017 | $1,616 | $96,210 | $47,730 | $48,480 |
| 2016 | $1,569 | $90,690 | $44,990 | $45,700 |
| 2015 | $1,456 | $90,690 | $44,990 | $45,700 |
| 2014 | $1,398 | $85,490 | $42,410 | $43,080 |
Source: Public Records
Map
Nearby Homes