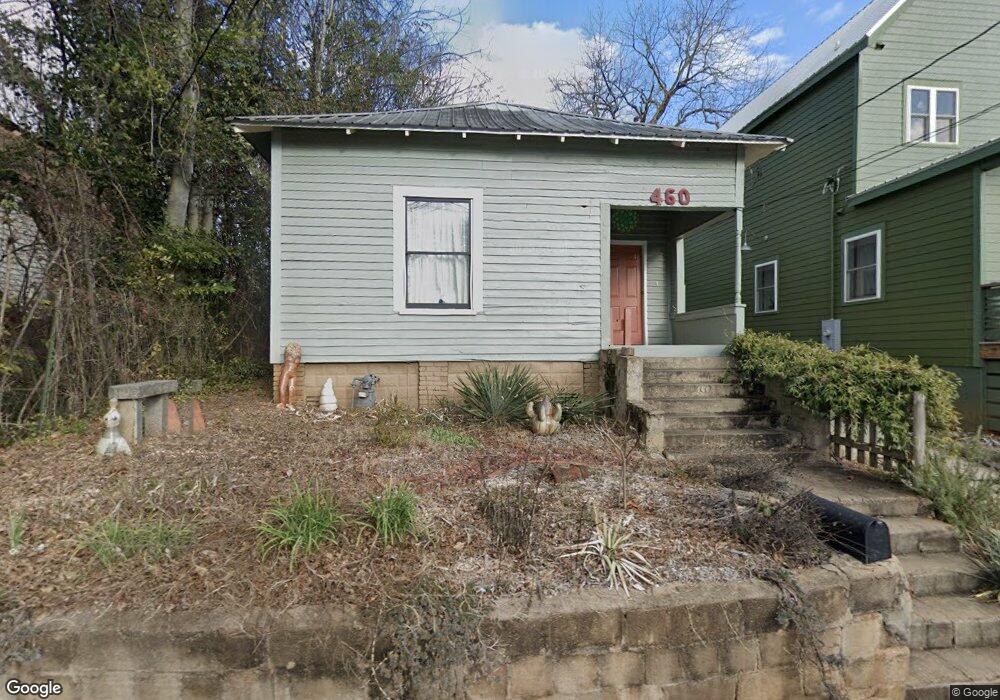
460 N Billups St Athens, GA 30606
Cobbham NeighborhoodEstimated Value: $221,224 - $287,000
--
Bed
--
Bath
887
Sq Ft
$293/Sq Ft
Est. Value
About This Home
This home is located at 460 N Billups St, Athens, GA 30606 and is currently estimated at $259,556, approximately $292 per square foot. 460 N Billups St is a home located in Clarke County with nearby schools including Johnnie Lay Burks Elementary School, Clarke Middle School, and Clarke Central High School.
Ownership History
Date
Name
Owned For
Owner Type
Purchase Details
Closed on
May 28, 2008
Sold by
Winter Shirey Erin L
Bought by
Steinberg Kerry N and Mack David D
Current Estimated Value
Home Financials for this Owner
Home Financials are based on the most recent Mortgage that was taken out on this home.
Original Mortgage
$100,800
Outstanding Balance
$64,019
Interest Rate
6.02%
Mortgage Type
New Conventional
Estimated Equity
$195,537
Purchase Details
Closed on
Oct 16, 2003
Sold by
Bartenfeld Christopher H
Bought by
Winter Erin and Shirey Jeff H
Purchase Details
Closed on
Mar 15, 2000
Sold by
Weaver Claudell Daniel F Lafla
Bought by
Bartenfeld Christopher H
Purchase Details
Closed on
Aug 8, 1996
Sold by
Weaver Claudell Lettie Mae Kyle
Bought by
Weaver Claudell Daniel F Laflamme
Create a Home Valuation Report for This Property
The Home Valuation Report is an in-depth analysis detailing your home's value as well as a comparison with similar homes in the area
Home Values in the Area
Average Home Value in this Area
Purchase History
| Date | Buyer | Sale Price | Title Company |
|---|---|---|---|
| Steinberg Kerry N | $112,000 | -- | |
| Winter Erin | $79,000 | -- | |
| Bartenfeld Christopher H | $49,900 | -- | |
| Weaver Claudell Daniel F Laflamme | -- | -- |
Source: Public Records
Mortgage History
| Date | Status | Borrower | Loan Amount |
|---|---|---|---|
| Open | Steinberg Kerry N | $100,800 |
Source: Public Records
Tax History Compared to Growth
Tax History
| Year | Tax Paid | Tax Assessment Tax Assessment Total Assessment is a certain percentage of the fair market value that is determined by local assessors to be the total taxable value of land and additions on the property. | Land | Improvement |
|---|---|---|---|---|
| 2025 | $2,086 | $87,849 | $28,000 | $59,849 |
| 2024 | $2,086 | $75,845 | $20,000 | $55,845 |
| 2023 | $1,007 | $67,217 | $20,000 | $47,217 |
| 2022 | $1,568 | $59,162 | $20,000 | $39,162 |
| 2021 | $1,303 | $48,670 | $20,000 | $28,670 |
| 2020 | $1,206 | $45,794 | $20,000 | $25,794 |
| 2019 | $1,061 | $41,262 | $20,000 | $21,262 |
| 2018 | $738 | $31,735 | $14,000 | $17,735 |
| 2017 | $667 | $29,634 | $12,000 | $17,634 |
| 2016 | $660 | $29,432 | $12,000 | $17,432 |
| 2015 | $514 | $25,099 | $12,000 | $13,099 |
| 2014 | $515 | $25,100 | $12,000 | $13,100 |
Source: Public Records
Map
Nearby Homes
- 480 N Billups St
- 1196 W Hancock Ave Unit 1
- 1198 W West Hancock Ave W
- 552 Cobb St
- 1226 W Broad St
- 468 N Milledge Ave Unit 203
- 1398 W Hancock Ave
- 597 Dearing St
- 283 King Ave
- 257 Hill St
- 570 Prince Ave
- 525 King Ave
- 365 S Church St Unit 1A, 1B, 1C
- 195 Beulah Ave
- 145 Sunset Dr
- 215 Holman Ave
- 100 Prince Ave Unit A404
- 100 Prince Ave Unit A407
- 452 N Billups St
- 426 N Billups St
- 500 N Billups St
- 422 N Billups St
- 463 N Billups St
- 390 N Billups St
- 451 N Billups St
- 481 N Billups St
- 423 N Billups St
- 483 N Billups St
- N N Billups St
- 516 N Billups St
- 126 Indale Ave
- 380 N Billups St
- 140 Indale Ave
- 385 N Billups St
- 1160 W Hancock Ave
- 1140 W Hancock Ave
- 150 Glenhaven Ave
- 1196 W Hancock Ave