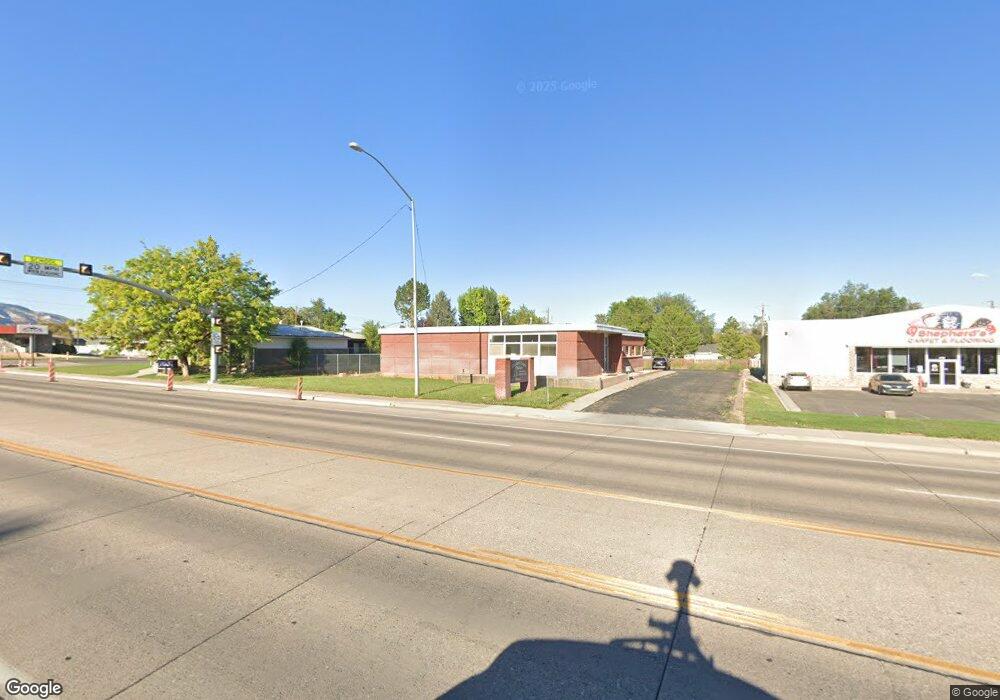
460 N Main St Richfield, UT 84701
Estimated Value: $1,075,000
--
Bed
--
Bath
--
Sq Ft
0.82
Acres
About This Home
This home is located at 460 N Main St, Richfield, UT 84701 and is currently priced at $1,075,000. 460 N Main St is a home located in Sevier County with nearby schools including Pahvant School, Ashman School, and Red Hills Middle School.
Ownership History
Date
Name
Owned For
Owner Type
Purchase Details
Closed on
May 5, 2022
Sold by
Wermillion Enterprises Llc
Bought by
Robertson Jacob and Robertson Tanna
Current Estimated Value
Purchase Details
Closed on
Dec 13, 2013
Sold by
Greenwood Carla C
Bought by
Vermillion Enterprises Llc
Home Financials for this Owner
Home Financials are based on the most recent Mortgage that was taken out on this home.
Original Mortgage
$285,000
Interest Rate
4.13%
Mortgage Type
Purchase Money Mortgage
Create a Home Valuation Report for This Property
The Home Valuation Report is an in-depth analysis detailing your home's value as well as a comparison with similar homes in the area
Home Values in the Area
Average Home Value in this Area
Purchase History
| Date | Buyer | Sale Price | Title Company |
|---|---|---|---|
| Robertson Jacob | -- | First American Title | |
| Vermillion Enterprises Llc | -- | Utah Title & Abstra |
Source: Public Records
Mortgage History
| Date | Status | Borrower | Loan Amount |
|---|---|---|---|
| Previous Owner | Vermillion Enterprises Llc | $285,000 |
Source: Public Records
Tax History Compared to Growth
Tax History
| Year | Tax Paid | Tax Assessment Tax Assessment Total Assessment is a certain percentage of the fair market value that is determined by local assessors to be the total taxable value of land and additions on the property. | Land | Improvement |
|---|---|---|---|---|
| 2024 | $775 | $78,335 | $63,908 | $14,427 |
| 2023 | $775 | $65,899 | $52,561 | $13,338 |
| 2022 | $582 | $53,165 | $42,048 | $11,117 |
| 2021 | $541 | $41,557 | $31,147 | $10,410 |
| 2020 | $516 | $38,587 | $31,147 | $7,440 |
| 2019 | $488 | $38,580 | $31,140 | $7,440 |
| 2018 | $493 | $34,970 | $31,140 | $3,830 |
| 2017 | $517 | $34,970 | $31,140 | $3,830 |
| 2016 | $346 | $34,970 | $0 | $0 |
| 2015 | $346 | $34,970 | $0 | $0 |
| 2014 | $346 | $34,970 | $0 | $0 |
Source: Public Records
Map
Nearby Homes