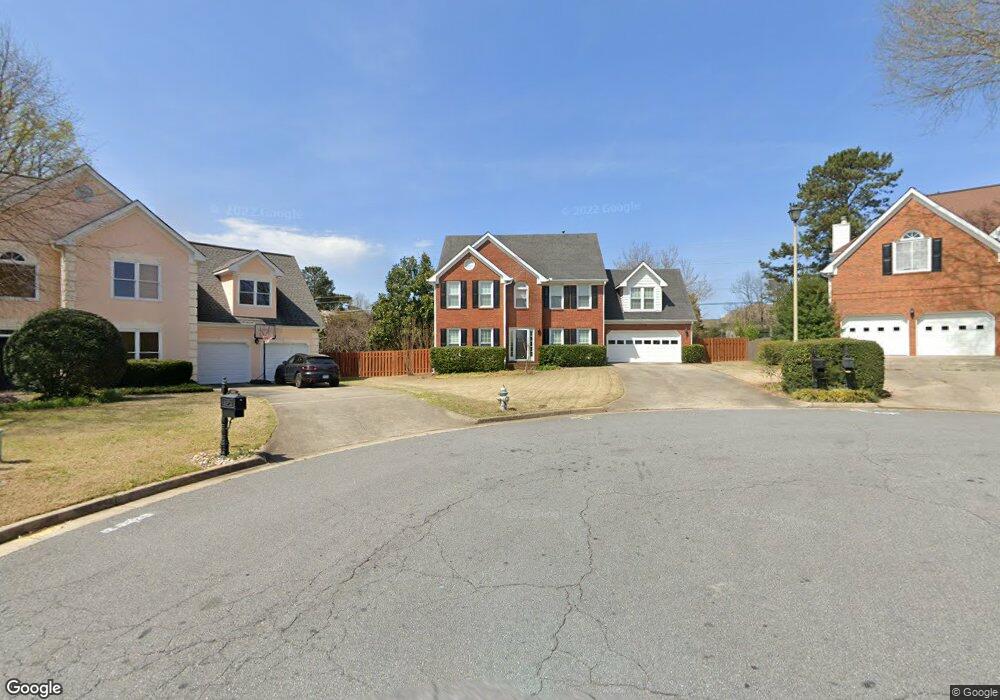
460 N Pine Dr Unit 2 Alpharetta, GA 30022
Estimated Value: $625,000 - $705,000
4
Beds
3
Baths
2,406
Sq Ft
$276/Sq Ft
Est. Value
About This Home
This home is located at 460 N Pine Dr Unit 2, Alpharetta, GA 30022 and is currently estimated at $662,882, approximately $275 per square foot. 460 N Pine Dr Unit 2 is a home located in Fulton County with nearby schools including Ocee Elementary School, Taylor Road Middle School, and Chattahoochee High School.
Ownership History
Date
Name
Owned For
Owner Type
Purchase Details
Closed on
Aug 31, 2005
Sold by
Park Gui S and Park In S
Bought by
Park Brian B
Current Estimated Value
Home Financials for this Owner
Home Financials are based on the most recent Mortgage that was taken out on this home.
Original Mortgage
$220,000
Outstanding Balance
$116,143
Interest Rate
5.64%
Mortgage Type
New Conventional
Estimated Equity
$546,739
Purchase Details
Closed on
Apr 9, 1997
Sold by
Wujcik Shawn T and Wujcik Eileen
Bought by
Park Gui S
Home Financials for this Owner
Home Financials are based on the most recent Mortgage that was taken out on this home.
Original Mortgage
$123,750
Interest Rate
7.98%
Mortgage Type
New Conventional
Create a Home Valuation Report for This Property
The Home Valuation Report is an in-depth analysis detailing your home's value as well as a comparison with similar homes in the area
Home Values in the Area
Average Home Value in this Area
Purchase History
| Date | Buyer | Sale Price | Title Company |
|---|---|---|---|
| Park Brian B | $275,000 | -- | |
| Park Gui S | $165,000 | -- |
Source: Public Records
Mortgage History
| Date | Status | Borrower | Loan Amount |
|---|---|---|---|
| Open | Park Brian B | $220,000 | |
| Previous Owner | Park Gui S | $123,750 |
Source: Public Records
Tax History Compared to Growth
Tax History
| Year | Tax Paid | Tax Assessment Tax Assessment Total Assessment is a certain percentage of the fair market value that is determined by local assessors to be the total taxable value of land and additions on the property. | Land | Improvement |
|---|---|---|---|---|
| 2025 | $575 | $211,720 | $42,000 | $169,720 |
| 2023 | $575 | $220,960 | $44,360 | $176,600 |
| 2022 | $2,906 | $162,240 | $35,360 | $126,880 |
| 2021 | $3,367 | $142,760 | $31,680 | $111,080 |
| 2020 | $3,385 | $141,240 | $31,720 | $109,520 |
| 2019 | $487 | $138,760 | $31,160 | $107,600 |
| 2018 | $3,249 | $135,480 | $30,400 | $105,080 |
| 2017 | $2,850 | $109,640 | $28,520 | $81,120 |
| 2016 | $2,835 | $109,400 | $28,520 | $80,880 |
| 2015 | $3,274 | $109,400 | $28,520 | $80,880 |
| 2014 | $2,221 | $85,200 | $19,440 | $65,760 |
Source: Public Records
Map
Nearby Homes
- 105 Kimball Bridge Cove
- 345 Kincardine Way Unit IIIA
- 3962 Erin Dr
- 10880 Windham Way
- 285 Rolling Mist Ct
- 4465 Hawthorn Cir
- 4462 Hawthorn Cir
- 4475 Hawthorn Cir
- 465 Kirkstall Trail
- 3920 Brookline Dr
- 3965 Brookline Dr
- 125 Sandridge Ct
- 710 Country Manor Way
- 3010 Brooke View Ct Unit 5
- 10845 Carrissa Trail
- 610 Varina Way
- 4465 Park Brooke Trace Unit 5
- 4345 Park Brooke Trace
- 465 N Pine Dr
- 450 N Pine Dr Unit 2
- 4060 Kimball Bridge Rd
- 440 N Pine Dr
- 455 N Pine Dr Unit 2
- 10700 S Kimball Bridge Crossing
- 116 Kia Dr
- 0 Kimball Bridge Rd Unit 8295524
- 0 Kimball Bridge Rd Unit 5939742
- 0 Kimball Bridge Rd Unit 7003379
- 0 Kimball Bridge Rd Unit 7141718
- 0 Kimball Bridge Rd Unit 7360727
- 0 Kimball Bridge Rd Unit 7475013
- 0 Kimball Bridge Rd Unit 8047755
- 0 Kimball Bridge Rd Unit 5182485
- 0 Kimball Bridge Rd Unit 5363457
- 0 Kimball Bridge Rd Unit 5557417
- 0 Kimball Bridge Rd Unit 5730131
- 0 Kimball Bridge Rd Unit 3192000
- 0 Kimball Bridge Rd Unit 8699998