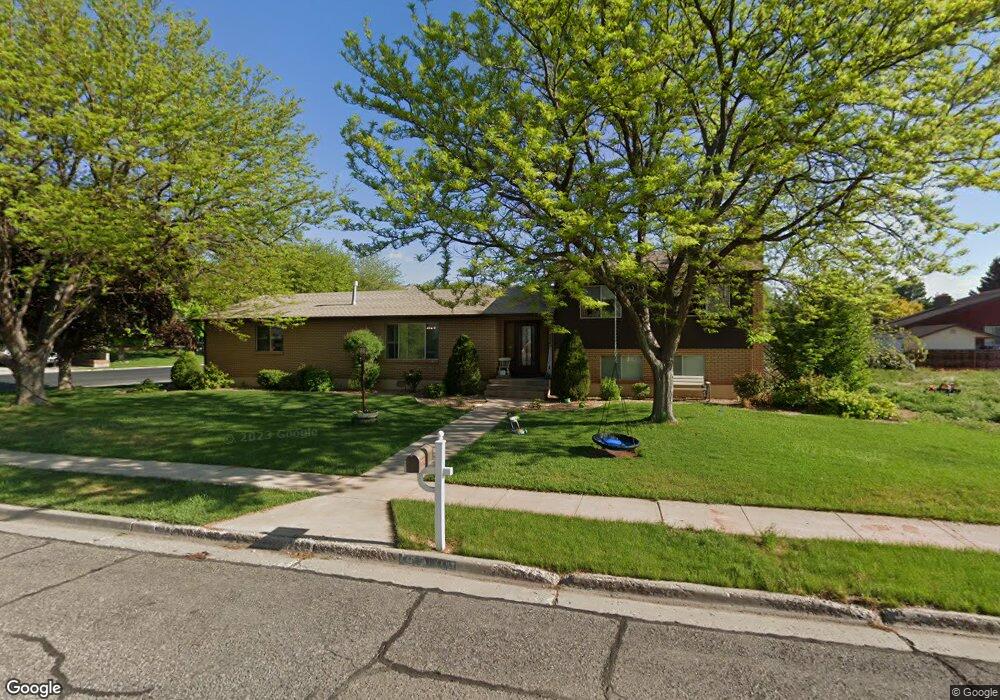
460 Pahvant Dr Richfield, UT 84701
Estimated Value: $418,488 - $494,000
4
Beds
3
Baths
3,272
Sq Ft
$140/Sq Ft
Est. Value
About This Home
This home is located at 460 Pahvant Dr, Richfield, UT 84701 and is currently estimated at $457,163, approximately $139 per square foot. 460 Pahvant Dr is a home located in Sevier County with nearby schools including Pahvant School, Ashman School, and Red Hills Middle School.
Ownership History
Date
Name
Owned For
Owner Type
Purchase Details
Closed on
Apr 9, 2019
Sold by
Offutt Bonnie J
Bought by
Mclemore Devin and Mclemore Leesa
Current Estimated Value
Home Financials for this Owner
Home Financials are based on the most recent Mortgage that was taken out on this home.
Original Mortgage
$222,659
Outstanding Balance
$197,003
Interest Rate
4.62%
Mortgage Type
FHA
Estimated Equity
$260,160
Create a Home Valuation Report for This Property
The Home Valuation Report is an in-depth analysis detailing your home's value as well as a comparison with similar homes in the area
Home Values in the Area
Average Home Value in this Area
Purchase History
| Date | Buyer | Sale Price | Title Company |
|---|---|---|---|
| Mclemore Devin | -- | First American Title | |
| Mclemore Devin | -- | First American Title |
Source: Public Records
Mortgage History
| Date | Status | Borrower | Loan Amount |
|---|---|---|---|
| Open | Mclemore Devin | $222,659 |
Source: Public Records
Tax History Compared to Growth
Tax History
| Year | Tax Paid | Tax Assessment Tax Assessment Total Assessment is a certain percentage of the fair market value that is determined by local assessors to be the total taxable value of land and additions on the property. | Land | Improvement |
|---|---|---|---|---|
| 2024 | $1,921 | $211,906 | $39,383 | $172,523 |
| 2023 | $2,097 | $225,042 | $37,681 | $187,361 |
| 2022 | $2,127 | $194,221 | $38,957 | $155,264 |
| 2021 | $1,934 | $148,623 | $31,659 | $116,964 |
| 2020 | $1,640 | $122,519 | $26,400 | $96,119 |
| 2019 | $1,387 | $109,690 | $22,000 | $87,690 |
| 2018 | $1,429 | $101,260 | $22,000 | $79,260 |
| 2017 | $1,414 | $95,640 | $22,000 | $73,640 |
| 2016 | $1,025 | $95,640 | $0 | $0 |
| 2015 | $1,025 | $93,840 | $0 | $0 |
| 2014 | $1,025 | $89,410 | $0 | $0 |
Source: Public Records
Map
Nearby Homes