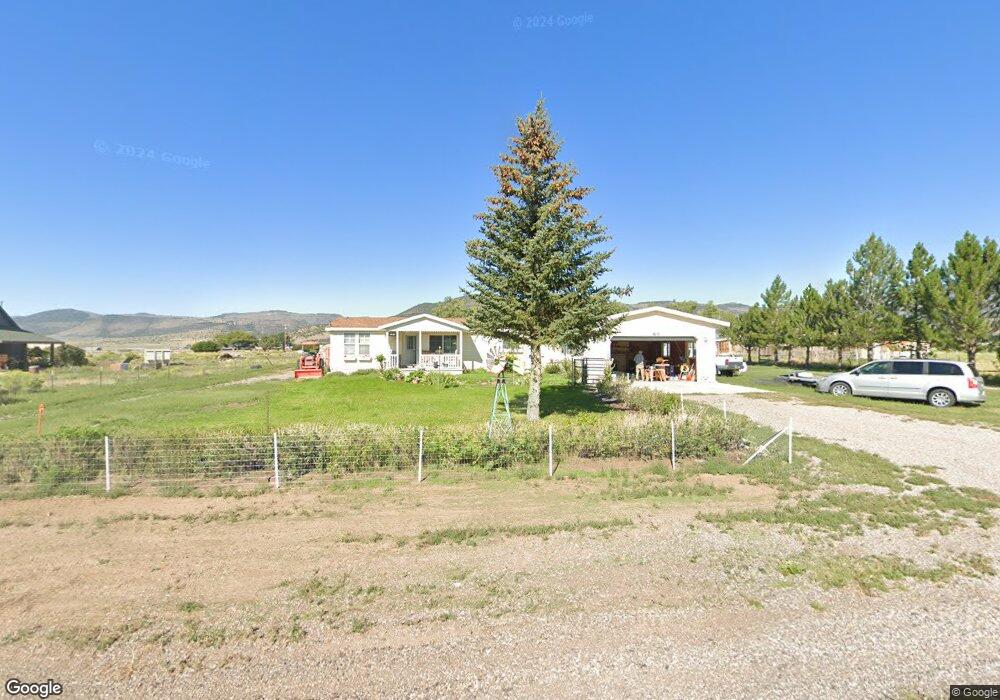
460 S 200 E Koosharem, UT 84744
Estimated Value: $329,000 - $425,000
4
Beds
2
Baths
1,820
Sq Ft
$197/Sq Ft
Est. Value
About This Home
This home is located at 460 S 200 E, Koosharem, UT 84744 and is currently estimated at $358,799, approximately $197 per square foot. 460 S 200 E is a home located in Sevier County with nearby schools including Koosharem Elementary School, South Sevier Middle School, and South Sevier High School.
Ownership History
Date
Name
Owned For
Owner Type
Purchase Details
Closed on
May 6, 2024
Sold by
Butcher Max and Butcher Sherla
Bought by
Ms Butcher Family Trust and Butcher
Current Estimated Value
Purchase Details
Closed on
Aug 12, 2022
Sold by
Max Butcher
Bought by
Butcher Max and Butcher Sherla
Purchase Details
Closed on
Jul 29, 2021
Sold by
Kunz Ronald E and Marlon E Kunz Living Trust
Bought by
Butcher Max and Butcher Sherla
Home Financials for this Owner
Home Financials are based on the most recent Mortgage that was taken out on this home.
Original Mortgage
$100,000
Interest Rate
2.93%
Mortgage Type
New Conventional
Purchase Details
Closed on
Dec 14, 2016
Sold by
Kunz Marlon E and Kunz Nadine M
Bought by
Kunz Ronald E and Kunz Living Trust
Purchase Details
Closed on
Aug 4, 2009
Sold by
Carlston Janet L
Bought by
Kunz Marlon E and Kunz Nandine M
Create a Home Valuation Report for This Property
The Home Valuation Report is an in-depth analysis detailing your home's value as well as a comparison with similar homes in the area
Purchase History
| Date | Buyer | Sale Price | Title Company |
|---|---|---|---|
| Ms Butcher Family Trust | -- | None Listed On Document | |
| Butcher Max | -- | None Listed On Document | |
| Butcher Max | -- | Professional Title | |
| Kunz Ronald E | -- | None Available | |
| Kunz Marlon E | -- | D Land Title |
Source: Public Records
Mortgage History
| Date | Status | Borrower | Loan Amount |
|---|---|---|---|
| Previous Owner | Butcher Max | $100,000 |
Source: Public Records
Tax History
| Year | Tax Paid | Tax Assessment Tax Assessment Total Assessment is a certain percentage of the fair market value that is determined by local assessors to be the total taxable value of land and additions on the property. | Land | Improvement |
|---|---|---|---|---|
| 2025 | $1,254 | $154,802 | $40,495 | $114,307 |
| 2024 | $1,254 | $157,515 | $36,325 | $121,190 |
| 2023 | $1,302 | $154,891 | $29,018 | $125,873 |
| 2022 | $1,278 | $133,883 | $28,989 | $104,894 |
| 2021 | $1,200 | $104,771 | $20,100 | $84,671 |
| 2020 | $1,156 | $95,092 | $16,750 | $78,342 |
| 2019 | $914 | $80,320 | $16,750 | $63,570 |
| 2018 | $1,009 | $79,090 | $16,750 | $62,340 |
| 2017 | $992 | $74,380 | $16,750 | $57,630 |
| 2016 | $761 | $71,280 | $0 | $0 |
| 2015 | $761 | $71,280 | $0 | $0 |
| 2014 | $761 | $71,280 | $0 | $0 |
Source: Public Records
Map
Nearby Homes
- 10 S 200 W
- 290 N 300 W
- 160 W 600 N
- 3810 N Burrville Rd
- 3810 N Burrville Rd
- 2033 S Sleepy Sage Ln
- 45 W Twin Creeks Rd
- Tbd 123 Monroe Canyon Rd
- 0 Monroe Mountain Rd
- 351 W Skyline Dr
- 479 S 500 St W
- 2 N Landslide Rd E
- 123 Tbd Monroe Canyon Rd
- 10 W 725 N Unit 10
- 7 W 725 N Unit 7
- 3 N Landslide Rd E Unit 3
- 123 Tbd West Cuonty Rd 1875
- 3 W 725 N Unit 3
- 4 W 725 N Unit 4
- 8 W 725 N Unit 8
Your Personal Tour Guide
Ask me questions while you tour the home.