Estimated Value: $266,000 - $291,657
3
Beds
2
Baths
1,211
Sq Ft
$226/Sq Ft
Est. Value
About This Home
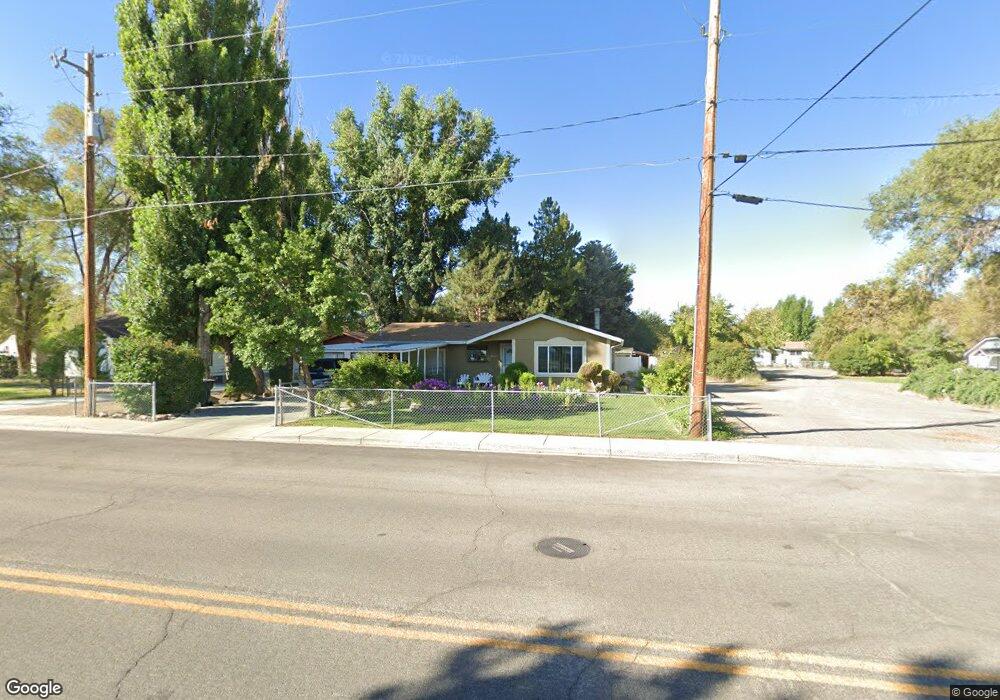
This home is located at 460 S 9th St, Elko, NV 89801 and is currently estimated at $273,164, approximately $225 per square foot. 460 S 9th St is a home located in Elko County with nearby schools including Southside Elementary School, Flagview Intermediate School, and Adobe Middle School.
Ownership History
Date
Name
Owned For
Owner Type
Purchase Details
Closed on
Apr 26, 2020
Sold by
Rodriguez Santiago and Rodriguez Maria
Bought by
Salazar Santiago Rodriguez and De Rodriguez Maria
Current Estimated Value
Purchase Details
Closed on
Jul 16, 2007
Sold by
Gardner Michael G and Gardner Danielle
Bought by
Grant George A and Grant Sarah J
Home Financials for this Owner
Home Financials are based on the most recent Mortgage that was taken out on this home.
Original Mortgage
$112,800
Interest Rate
6.65%
Mortgage Type
Purchase Money Mortgage
Create a Home Valuation Report for This Property
The Home Valuation Report is an in-depth analysis detailing your home's value as well as a comparison with similar homes in the area
Home Values in the Area
Average Home Value in this Area
Purchase History
| Date | Buyer | Sale Price | Title Company |
|---|---|---|---|
| Salazar Santiago Rodriguez | -- | None Available | |
| Grant George A | $141,000 | Stewart Title |
Source: Public Records
Mortgage History
| Date | Status | Borrower | Loan Amount |
|---|---|---|---|
| Open | Rodriguez Santiago | $30,000 | |
| Open | Rodriguez Santiago | $76,660 | |
| Closed | Rodriguez Santiago S | $50,000 | |
| Closed | Grant George A | $112,800 |
Source: Public Records
Tax History Compared to Growth
Tax History
| Year | Tax Paid | Tax Assessment Tax Assessment Total Assessment is a certain percentage of the fair market value that is determined by local assessors to be the total taxable value of land and additions on the property. | Land | Improvement |
|---|---|---|---|---|
| 2025 | $1,022 | $36,474 | $13,650 | $22,824 |
| 2024 | $1,022 | $29,930 | $6,020 | $23,910 |
| 2023 | $1,022 | $28,800 | $6,020 | $22,780 |
| 2022 | $911 | $24,836 | $6,020 | $18,816 |
| 2021 | $907 | $24,731 | $6,020 | $18,711 |
| 2020 | $883 | $25,332 | $6,020 | $19,312 |
| 2019 | $864 | $24,777 | $6,020 | $18,757 |
| 2018 | $878 | $25,183 | $6,020 | $19,163 |
| 2017 | $880 | $25,242 | $6,020 | $19,222 |
| 2016 | $898 | $25,560 | $6,020 | $19,540 |
| 2015 | $890 | $25,527 | $6,020 | $19,507 |
| 2014 | $890 | $24,933 | $6,020 | $18,913 |
Source: Public Records
Map
Nearby Homes