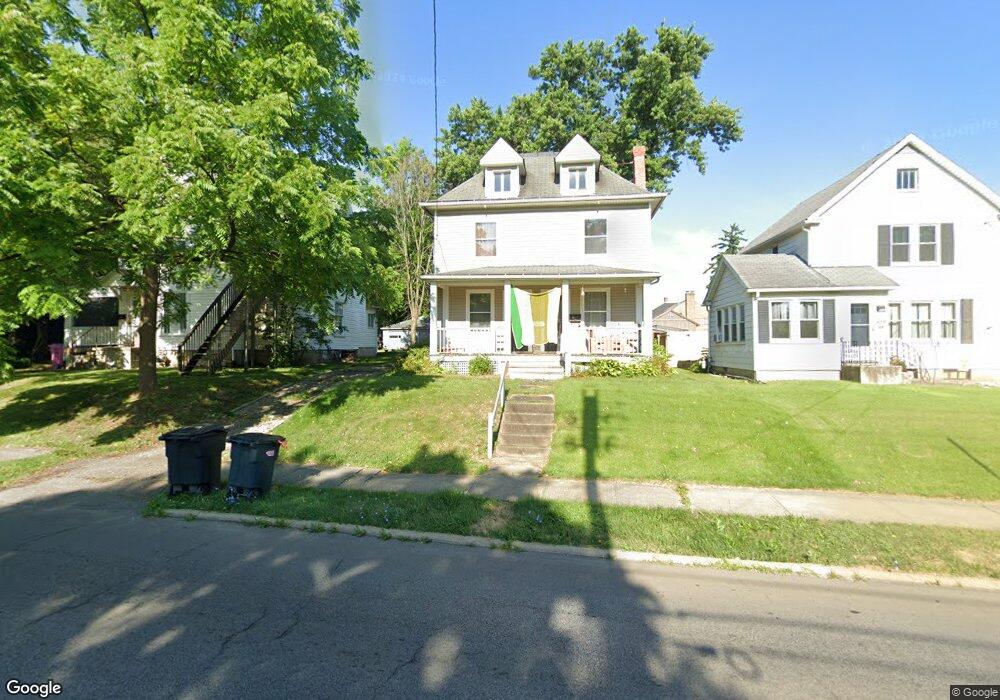
460 S Main St Mansfield, OH 44907
Estimated Value: $85,000 - $108,000
3
Beds
2
Baths
1,723
Sq Ft
$55/Sq Ft
Est. Value
About This Home
This home is located at 460 S Main St, Mansfield, OH 44907 and is currently estimated at $94,623, approximately $54 per square foot. 460 S Main St is a home located in Richland County with nearby schools including St. Peter's Elementary/Montessori School, Discovery School, and St. Peter's Junior High / High School.
Ownership History
Date
Name
Owned For
Owner Type
Purchase Details
Closed on
Apr 30, 2025
Sold by
Phillips Eric E and Phillips Ashley
Bought by
Buchman Llc
Current Estimated Value
Home Financials for this Owner
Home Financials are based on the most recent Mortgage that was taken out on this home.
Original Mortgage
$80,000
Outstanding Balance
$79,718
Interest Rate
6.67%
Mortgage Type
New Conventional
Estimated Equity
$14,905
Purchase Details
Closed on
Jul 30, 2018
Sold by
Phillips Steven A
Bought by
Phillips Eric E
Purchase Details
Closed on
Apr 23, 2015
Sold by
Phillips Steven A and Phillips Pamela R
Bought by
Richland Rentals Llc
Purchase Details
Closed on
Feb 1, 2006
Sold by
Phillips Steven A and Phillips Pamela R
Bought by
Phillips Steven A and Phillips Pamela R
Create a Home Valuation Report for This Property
The Home Valuation Report is an in-depth analysis detailing your home's value as well as a comparison with similar homes in the area
Home Values in the Area
Average Home Value in this Area
Purchase History
| Date | Buyer | Sale Price | Title Company |
|---|---|---|---|
| Buchman Llc | $100,000 | American Title | |
| Buchman Llc | $100,000 | American Title | |
| Phillips Eric E | -- | None Available | |
| Phillips Steven A | -- | None Available | |
| Richland Rentals Llc | -- | Attorney | |
| Phillips Steven A | -- | None Available |
Source: Public Records
Mortgage History
| Date | Status | Borrower | Loan Amount |
|---|---|---|---|
| Open | Buchman Llc | $80,000 | |
| Closed | Buchman Llc | $80,000 |
Source: Public Records
Tax History
| Year | Tax Paid | Tax Assessment Tax Assessment Total Assessment is a certain percentage of the fair market value that is determined by local assessors to be the total taxable value of land and additions on the property. | Land | Improvement |
|---|---|---|---|---|
| 2024 | $597 | $13,040 | $4,680 | $8,360 |
| 2023 | $611 | $13,040 | $4,680 | $8,360 |
| 2022 | $610 | $10,910 | $4,440 | $6,470 |
| 2021 | $614 | $10,910 | $4,440 | $6,470 |
| 2020 | $628 | $10,910 | $4,440 | $6,470 |
| 2019 | $589 | $9,240 | $3,760 | $5,480 |
| 2018 | $1,195 | $19,000 | $3,760 | $15,240 |
| 2017 | $1,163 | $19,000 | $3,760 | $15,240 |
| 2016 | $1,142 | $18,090 | $3,570 | $14,520 |
| 2015 | $1,142 | $18,090 | $3,570 | $14,520 |
| 2014 | $1,076 | $18,090 | $3,570 | $14,520 |
| 2012 | $863 | $19,040 | $3,760 | $15,280 |
Source: Public Records
Map
Nearby Homes
- 394 S Main St
- 377 S Main St
- 27 Dunbilt Ct
- 219 Lexington Ave
- 286 S Main St
- 101 Chilton Ave
- 151 Grover St
- 0 Cline Ave Hedeen Abbeyfeale Unit 9066362
- 273 Hammond Ave
- 133 Winwood Dr
- 22 Small Ave
- 29 Ford Ave
- 212 S Main St
- 530 Wood St
- 507 Townview Cir E
- 466 Lexington Ave
- 470 Lexington Ave
- 519 S Diamond St
- 310 Townview Cir N
- 175 S Mulberry St
- 460 S Main St
- 464 S Main St
- 464 S Main St Unit 464 and a Half S. Ma
- 458 S Main St
- 474 S Main St
- 476 S Main St
- 454 S Main St
- 15 W Prospect St
- 27 W Prospect St
- 478 S Main St
- 22 Reba Ave
- 20 Reba Ave
- 29 W Prospect St
- 24 Reba Ave
- 479 S Main St
- 446 S Main St
- 31 W Prospect St
- 18 W Prospect St
- 455 S Main St
- 465 S Main St
Your Personal Tour Guide
Ask me questions while you tour the home.