Estimated Value: $472,000 - $561,000
4
Beds
2
Baths
2,828
Sq Ft
$180/Sq Ft
Est. Value
About This Home
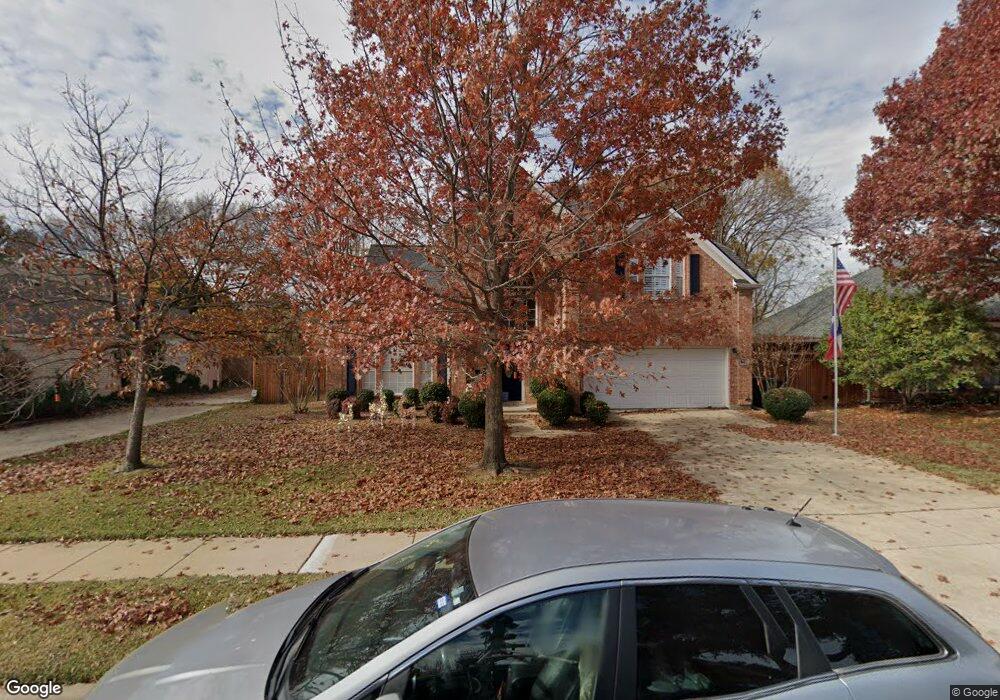
This home is located at 460 Shade Tree Cir, Hurst, TX 76054 and is currently estimated at $509,523, approximately $180 per square foot. 460 Shade Tree Cir is a home located in Tarrant County with nearby schools including Shady Oaks Elementary School, Bedford Junior High School, and L.D. Bell High School.
Ownership History
Date
Name
Owned For
Owner Type
Purchase Details
Closed on
Aug 9, 2019
Sold by
Escano Guy and Escano Christi
Bought by
Diedrick Robert E and Diedrick Barbara
Current Estimated Value
Purchase Details
Closed on
Sep 10, 2001
Sold by
Cobb James P and Cobb Jeanne B
Bought by
Escano Guy N and Escano Christi L
Home Financials for this Owner
Home Financials are based on the most recent Mortgage that was taken out on this home.
Original Mortgage
$211,554
Interest Rate
5.95%
Mortgage Type
VA
Purchase Details
Closed on
Dec 28, 1993
Sold by
The Ryland Group Inc
Bought by
Cobb James P and Cobb Jeanne B
Home Financials for this Owner
Home Financials are based on the most recent Mortgage that was taken out on this home.
Original Mortgage
$125,300
Interest Rate
7.29%
Create a Home Valuation Report for This Property
The Home Valuation Report is an in-depth analysis detailing your home's value as well as a comparison with similar homes in the area
Home Values in the Area
Average Home Value in this Area
Purchase History
| Date | Buyer | Sale Price | Title Company |
|---|---|---|---|
| Diedrick Robert E | -- | None Available | |
| Escano Guy N | -- | Hexter Fair Title Co | |
| Cobb James P | -- | -- |
Source: Public Records
Mortgage History
| Date | Status | Borrower | Loan Amount |
|---|---|---|---|
| Previous Owner | Escano Guy N | $211,554 | |
| Previous Owner | Cobb James P | $125,300 |
Source: Public Records
Tax History Compared to Growth
Tax History
| Year | Tax Paid | Tax Assessment Tax Assessment Total Assessment is a certain percentage of the fair market value that is determined by local assessors to be the total taxable value of land and additions on the property. | Land | Improvement |
|---|---|---|---|---|
| 2025 | $9,701 | $494,400 | $90,000 | $404,400 |
| 2024 | $9,701 | $494,400 | $90,000 | $404,400 |
| 2023 | $7,929 | $411,316 | $90,000 | $321,316 |
| 2022 | $8,284 | $404,765 | $90,000 | $314,765 |
| 2021 | $7,889 | $327,092 | $90,000 | $237,092 |
| 2020 | $8,247 | $342,780 | $90,000 | $252,780 |
| 2019 | $7,676 | $326,664 | $90,000 | $236,664 |
| 2018 | $6,265 | $285,100 | $90,000 | $195,100 |
| 2017 | $6,559 | $326,307 | $35,000 | $291,307 |
| 2016 | $5,962 | $287,899 | $35,000 | $252,899 |
| 2015 | $5,083 | $214,200 | $25,000 | $189,200 |
| 2014 | $5,083 | $214,200 | $25,000 | $189,200 |
Source: Public Records
Map
Nearby Homes
- 421 Cavender Ct
- 520 Baker Dr
- 440 W Louella Dr
- 2212 Hurstview Dr
- 2244 Hurstview Dr
- 404 Heather Ln
- 608 W Pleasantview Dr
- 425 W Pleasantview Dr
- 1625 Oak Creek Dr
- 521 Brookview Dr
- 121 Kay Ct
- 124 Jeannie Ct
- 100 Hillview Ct
- 1732 Jeannie Ln
- 229 Brookview Dr
- 432 Sunnybrook Ct
- 823 W Harwood Rd
- 320 Blue Quail Ct
- 2668 Bent Tree Dr
- 305 Warbler Dr
- 464 Shade Tree Cir
- 458 Shade Tree Cir
- 1916 Hurstview Dr
- 1912 Hurstview Dr
- 468 Shade Tree Cir
- 1920 Hurstview Dr
- 437 Shade Tree Cir
- 1908 Hurstview Dr
- 441 Shade Tree Cir
- 433 Shade Tree Cir
- 454 Shade Tree Cir
- 1924 Hurstview Dr
- 470 Shade Tree Cir
- 450 Shade Tree Cir
- 445 Shade Tree Cir
- 1904 Hurstview Dr
- 429 Shade Tree Cir
- 1928 Hurstview Dr
- 472 Shade Tree Cir
- 457 Shade Tree Ct