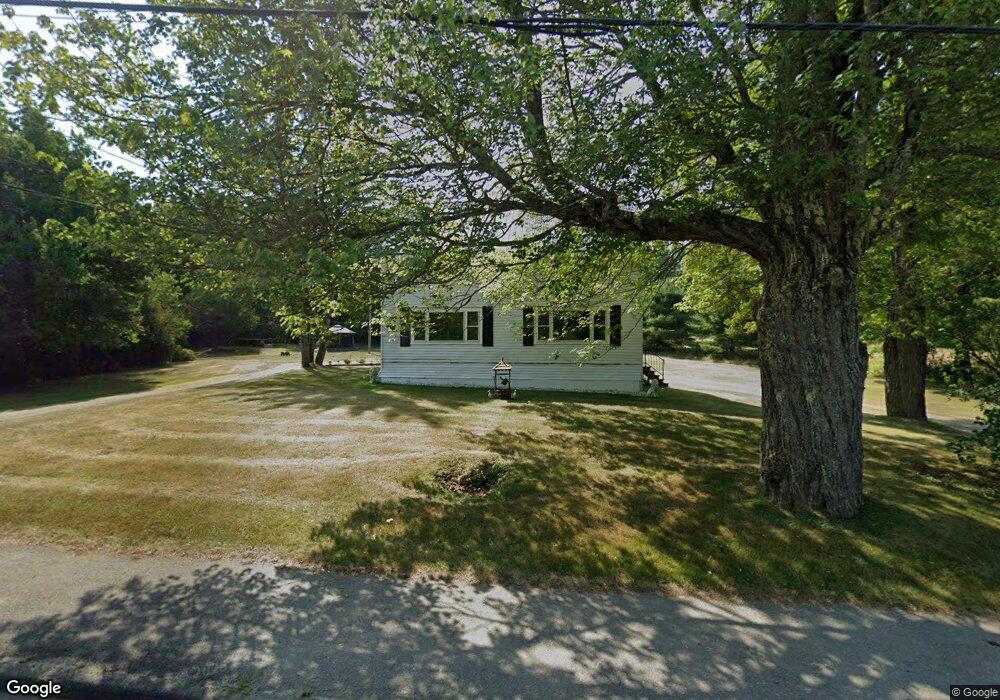
460 South St Calais, ME 04619
Estimated Value: $96,000 - $236,000
4
Beds
2
Baths
978
Sq Ft
$163/Sq Ft
Est. Value
About This Home
This home is located at 460 South St, Calais, ME 04619 and is currently estimated at $159,400, approximately $162 per square foot. 460 South St is a home with nearby schools including Calais Elementary School and Calais Middle/High School.
Ownership History
Date
Name
Owned For
Owner Type
Purchase Details
Closed on
Jun 12, 2023
Sold by
Rayn Heidi G
Bought by
Seeley Heather L and Lyons David J
Current Estimated Value
Home Financials for this Owner
Home Financials are based on the most recent Mortgage that was taken out on this home.
Original Mortgage
$75,450
Outstanding Balance
$73,432
Interest Rate
6.39%
Mortgage Type
Purchase Money Mortgage
Estimated Equity
$85,968
Purchase Details
Closed on
Sep 21, 2006
Sold by
Ryan Theresa
Bought by
Ryan Heidi G and Braughton John R
Home Financials for this Owner
Home Financials are based on the most recent Mortgage that was taken out on this home.
Original Mortgage
$64,350
Interest Rate
7%
Mortgage Type
Adjustable Rate Mortgage/ARM
Create a Home Valuation Report for This Property
The Home Valuation Report is an in-depth analysis detailing your home's value as well as a comparison with similar homes in the area
Home Values in the Area
Average Home Value in this Area
Purchase History
| Date | Buyer | Sale Price | Title Company |
|---|---|---|---|
| Seeley Heather L | $78,000 | None Available | |
| Ryan Heidi G | -- | -- |
Source: Public Records
Mortgage History
| Date | Status | Borrower | Loan Amount |
|---|---|---|---|
| Open | Seeley Heather L | $75,450 | |
| Previous Owner | Ryan Heidi G | $64,350 |
Source: Public Records
Tax History Compared to Growth
Tax History
| Year | Tax Paid | Tax Assessment Tax Assessment Total Assessment is a certain percentage of the fair market value that is determined by local assessors to be the total taxable value of land and additions on the property. | Land | Improvement |
|---|---|---|---|---|
| 2024 | $1,766 | $117,700 | $31,800 | $85,900 |
| 2023 | $1,727 | $101,600 | $27,500 | $74,100 |
| 2022 | $1,560 | $82,100 | $22,200 | $59,900 |
| 2021 | $1,700 | $78,700 | $21,300 | $57,400 |
| 2020 | $1,703 | $67,300 | $18,200 | $49,100 |
| 2019 | $1,703 | $67,300 | $18,200 | $49,100 |
| 2018 | $1,703 | $67,300 | $18,200 | $49,100 |
| 2017 | $1,703 | $67,300 | $18,200 | $49,100 |
| 2016 | $1,703 | $67,300 | $18,200 | $49,100 |
| 2015 | $1,703 | $67,300 | $18,200 | $49,100 |
| 2014 | $1,703 | $67,300 | $18,200 | $49,100 |
| 2013 | $1,703 | $67,300 | $18,200 | $49,100 |
Source: Public Records
Map
Nearby Homes
- 445 South St
- 43 Harrison St
- 332 North St
- 71-75 Baring St
- 33 Pleasant St
- M5B7L8 Pleasant St
- 100 Barker St
- 69 Lafayette St
- P/O Lot 6 Higgins Farm Rd
- Lot 5 Higgins Farm Rd
- Lot 4 Higgins Farm Rd
- 24 Todd St
- 1 Downes St
- 158 South St
- 89 Washington St
- 48 Germain St
- 37 Price St
- 35 Germain St
- 34 Price St
- 112 South St