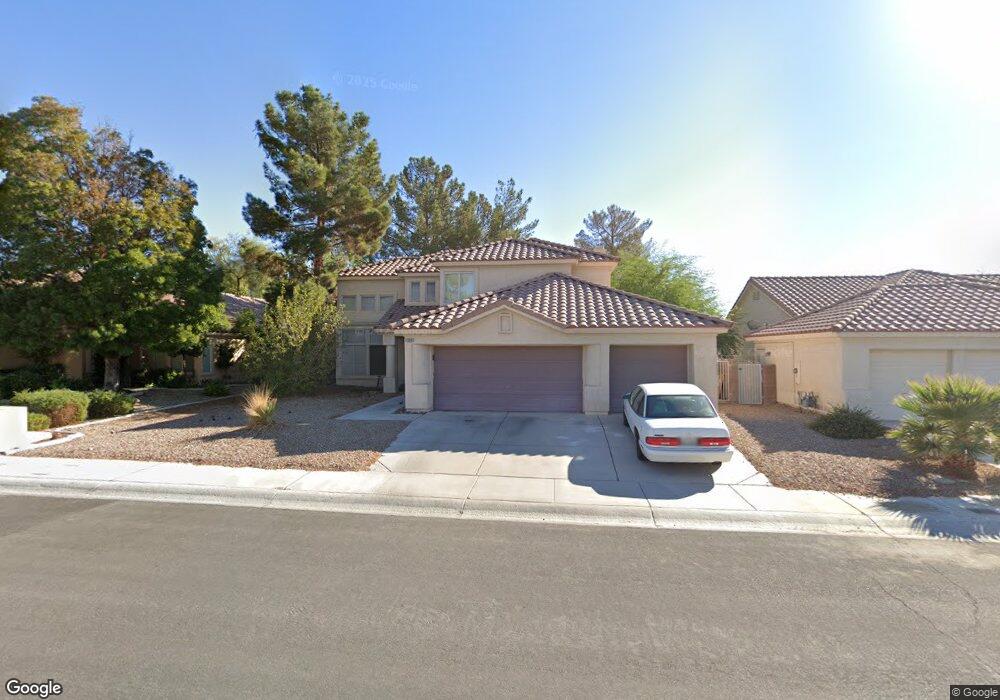
4600 Gonzales Dr Unit 10A Las Vegas, NV 89130
North Cheyenne NeighborhoodEstimated Value: $498,385 - $528,000
3
Beds
3
Baths
2,322
Sq Ft
$223/Sq Ft
Est. Value
About This Home
This home is located at 4600 Gonzales Dr Unit 10A, Las Vegas, NV 89130 and is currently estimated at $516,846, approximately $222 per square foot. 4600 Gonzales Dr Unit 10A is a home located in Clark County with nearby schools including Ernest May Elementary School, Theron L Swainston Middle School, and Cheyenne High School.
Ownership History
Date
Name
Owned For
Owner Type
Purchase Details
Closed on
Apr 13, 2011
Sold by
Wells Fargo Bank N A
Bought by
Foreman Robert A
Current Estimated Value
Home Financials for this Owner
Home Financials are based on the most recent Mortgage that was taken out on this home.
Original Mortgage
$141,226
Outstanding Balance
$97,570
Interest Rate
4.83%
Mortgage Type
FHA
Estimated Equity
$419,276
Purchase Details
Closed on
Jan 13, 2011
Sold by
Crum Tulsa and Crum Jennifer
Bought by
Wells Fargo Bank N A
Purchase Details
Closed on
Jul 6, 2004
Sold by
Rankin William R and Rankin Diana L
Bought by
Crum Tulsa and Crum Jennifer
Home Financials for this Owner
Home Financials are based on the most recent Mortgage that was taken out on this home.
Original Mortgage
$296,000
Interest Rate
6.27%
Mortgage Type
Stand Alone First
Create a Home Valuation Report for This Property
The Home Valuation Report is an in-depth analysis detailing your home's value as well as a comparison with similar homes in the area
Home Values in the Area
Average Home Value in this Area
Purchase History
| Date | Buyer | Sale Price | Title Company |
|---|---|---|---|
| Foreman Robert A | $144,900 | Fidelity Rainbow | |
| Foreman Robert A | $144,900 | Fidelity Rainbow | |
| Wells Fargo Bank N A | $144,409 | Accommodation | |
| Crum Tulsa | $380,000 | Ticor Title Of Nevada Inc |
Source: Public Records
Mortgage History
| Date | Status | Borrower | Loan Amount |
|---|---|---|---|
| Open | Foreman Robert A | $141,226 | |
| Closed | Foreman Robert A | $141,226 | |
| Previous Owner | Crum Tulsa | $296,000 |
Source: Public Records
Tax History Compared to Growth
Tax History
| Year | Tax Paid | Tax Assessment Tax Assessment Total Assessment is a certain percentage of the fair market value that is determined by local assessors to be the total taxable value of land and additions on the property. | Land | Improvement |
|---|---|---|---|---|
| 2025 | $2,882 | $102,922 | $34,650 | $68,272 |
| 2024 | $3,575 | $102,922 | $34,650 | $68,272 |
| 2023 | $1,812 | $97,717 | $32,200 | $65,517 |
| 2022 | $2,170 | $86,795 | $26,600 | $60,195 |
| 2021 | $2,009 | $81,045 | $23,450 | $57,595 |
| 2020 | $1,863 | $79,751 | $22,400 | $57,351 |
| 2019 | $1,746 | $76,459 | $19,600 | $56,859 |
| 2018 | $1,666 | $70,842 | $16,100 | $54,742 |
| 2017 | $2,298 | $70,099 | $14,350 | $55,749 |
| 2016 | $1,812 | $66,670 | $10,500 | $56,170 |
| 2015 | $2,052 | $57,727 | $8,750 | $48,977 |
| 2014 | $1,805 | $48,105 | $7,000 | $41,105 |
Source: Public Records
Map
Nearby Homes
- 5309 Camino Del Rancho
- 5213 Red Glory Dr
- 4708 Royal Sunset Ct
- 5213 Tamanar Dr
- 4801 Fiesta Lakes St
- 4708 English Ivy Ct
- 4808 Fiesta Lakes St
- 5004 Camino Del Rancho
- 4817 Friar Ln
- 4816 Fiesta Lakes St
- 4821 Fiesta Lakes St
- 5104 Brookmere Dr
- 4833 Fiesta Lakes St
- 4852 Maryvale Dr
- 4401 Inez Dr
- 4872 Maryvale Dr
- 5812 Ventana Dr
- 4905 Ocean Shores Way
- 4800 Baffin Ct
- 4904 Pinon Dr
- 4572 Gonzales Dr Unit 4572
- 4572 Gonzales Dr
- 4572 Gonzales Dr Unit n/a
- 4604 Gonzales Dr
- 5353 Venado Dr
- 4573 Cielo Ln
- 4568 Gonzales Dr
- 4608 Gonzales Dr
- 4569 Cielo Ln
- 4601 Gonzales Dr
- 4577 Cielo Ln
- 4605 Gonzales Dr
- 4573 Gonzales Dr
- 4564 Gonzales Dr
- 4609 Gonzales Dr Unit 10A
- 4565 Cielo Ln
- 4569 Gonzales Dr
- 4617 Savin Cir
- 8089 Cielo Ln
- 4617 Pompano Cir