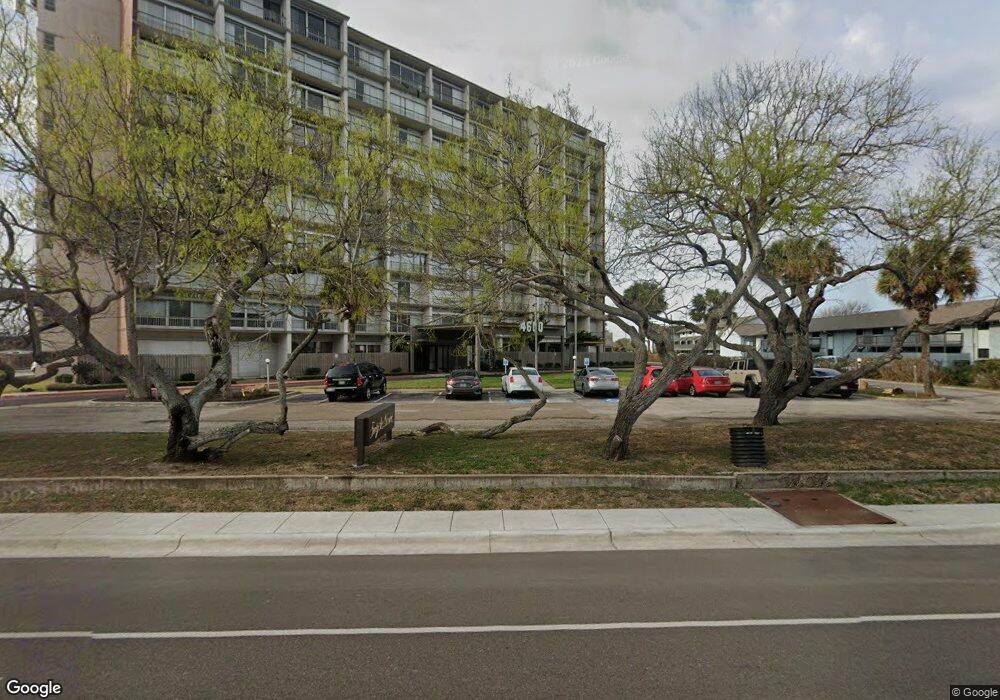
Forty Six Hundred 4600 Ocean Dr Unit 305 Corpus Christi, TX 78412
Bay Area NeighborhoodEstimated Value: $144,680 - $182,000
2
Beds
1
Bath
871
Sq Ft
$195/Sq Ft
Est. Value
About This Home
This home is located at 4600 Ocean Dr Unit 305, Corpus Christi, TX 78412 and is currently estimated at $170,170, approximately $195 per square foot. 4600 Ocean Dr Unit 305 is a home located in Nueces County with nearby schools including Montclair Elementary School, Haas Middle School, and King High School.
Ownership History
Date
Name
Owned For
Owner Type
Purchase Details
Closed on
Nov 7, 2013
Sold by
Pender Barbara Wendl
Bought by
Sr & Zss Partnership Ltd
Current Estimated Value
Purchase Details
Closed on
Dec 28, 2009
Sold by
E E W Rental Properties Llc
Bought by
Pender Barbara Wendl
Home Financials for this Owner
Home Financials are based on the most recent Mortgage that was taken out on this home.
Original Mortgage
$67,000
Interest Rate
4.9%
Mortgage Type
Seller Take Back
Purchase Details
Closed on
Apr 28, 2009
Sold by
Castle Robin Cheryl and Cain Robin C
Bought by
E E W Rental Properties Llc
Purchase Details
Closed on
Aug 19, 2005
Sold by
Ingils Gail
Bought by
Cain Joe R and Cain Robin C
Home Financials for this Owner
Home Financials are based on the most recent Mortgage that was taken out on this home.
Original Mortgage
$73,387
Interest Rate
5.65%
Mortgage Type
New Conventional
Create a Home Valuation Report for This Property
The Home Valuation Report is an in-depth analysis detailing your home's value as well as a comparison with similar homes in the area
Home Values in the Area
Average Home Value in this Area
Purchase History
| Date | Buyer | Sale Price | Title Company |
|---|---|---|---|
| Sr & Zss Partnership Ltd | -- | Stewart Title | |
| Pender Barbara Wendl | -- | None Available | |
| E E W Rental Properties Llc | -- | Security Title | |
| Castle Robin Cheryl | -- | Security Title | |
| Cain Joe R | -- | Stewart Title |
Source: Public Records
Mortgage History
| Date | Status | Borrower | Loan Amount |
|---|---|---|---|
| Previous Owner | Pender Barbara Wendl | $67,000 | |
| Previous Owner | Cain Joe R | $73,387 |
Source: Public Records
Tax History Compared to Growth
Tax History
| Year | Tax Paid | Tax Assessment Tax Assessment Total Assessment is a certain percentage of the fair market value that is determined by local assessors to be the total taxable value of land and additions on the property. | Land | Improvement |
|---|---|---|---|---|
| 2025 | $3,087 | $165,224 | $24,596 | $140,628 |
| 2024 | $3,087 | $141,946 | $0 | $0 |
| 2023 | $2,521 | $118,288 | $17,028 | $101,260 |
| 2022 | $2,536 | $101,940 | $17,028 | $84,912 |
| 2021 | $2,139 | $81,812 | $17,028 | $64,784 |
| 2020 | $2,369 | $90,389 | $16,713 | $73,676 |
| 2019 | $2,373 | $89,746 | $16,713 | $73,033 |
| 2018 | $2,321 | $91,662 | $16,713 | $74,949 |
| 2017 | $2,411 | $95,491 | $16,713 | $78,778 |
| 2016 | $2,357 | $93,342 | $16,713 | $76,629 |
| 2015 | $1,907 | $80,530 | $16,713 | $63,817 |
| 2014 | $1,907 | $75,000 | $9,285 | $65,715 |
Source: Public Records
About Forty Six Hundred
Map
Nearby Homes
- 4600 Ocean Dr Unit 1002
- 4600 Ocean Dr Unit 602
- 4600 Ocean Dr
- 4600 Ocean Dr Unit 707
- 4600 Ocean Dr Unit 308
- 4600 Ocean Dr Unit 904
- 4500 Ocean Dr Unit 4B
- 4500 Ocean Dr Unit 1B
- 4454 Ocean Dr Unit 4
- 4350 Ocean Dr
- 4350 Ocean Dr Unit 202
- 4350 Ocean Dr Unit 303
- 4350 Ocean Dr Unit 704
- 4334 Ocean Dr Unit 705
- 4334 Ocean Dr Unit 306
- 53 Camden Place
- 4815 Ocean Dr
- 4811 Ocean Dr
- 402 Pennington Dr
- 4302 Ocean Dr Unit 42
- 4600 Ocean Dr Unit 201
- 4600 Ocean Dr Unit 505
- 4600 Ocean Dr Unit 203
- 4600 Ocean Dr Unit 302
- 4600 Ocean Dr Unit 907
- 4600 Ocean Dr Unit 701
- 4600 Ocean Dr Unit 1004
- 4600 Ocean Dr Unit 603
- 4600 Ocean Dr Unit 607
- 4600 Ocean Dr Unit 407
- 4600 Ocean Dr Unit 906
- 4600 Ocean Dr Unit 503
- 4600 Ocean Dr Unit 201
- 4600 Ocean Dr Unit 308
- 4600 Ocean Dr Unit 504
- 4600 Ocean Dr
- 4600 Ocean Dr
- 4600 Ocean Dr
- 4600 Ocean Dr Unit 905
- 4600 Ocean Dr Unit 802