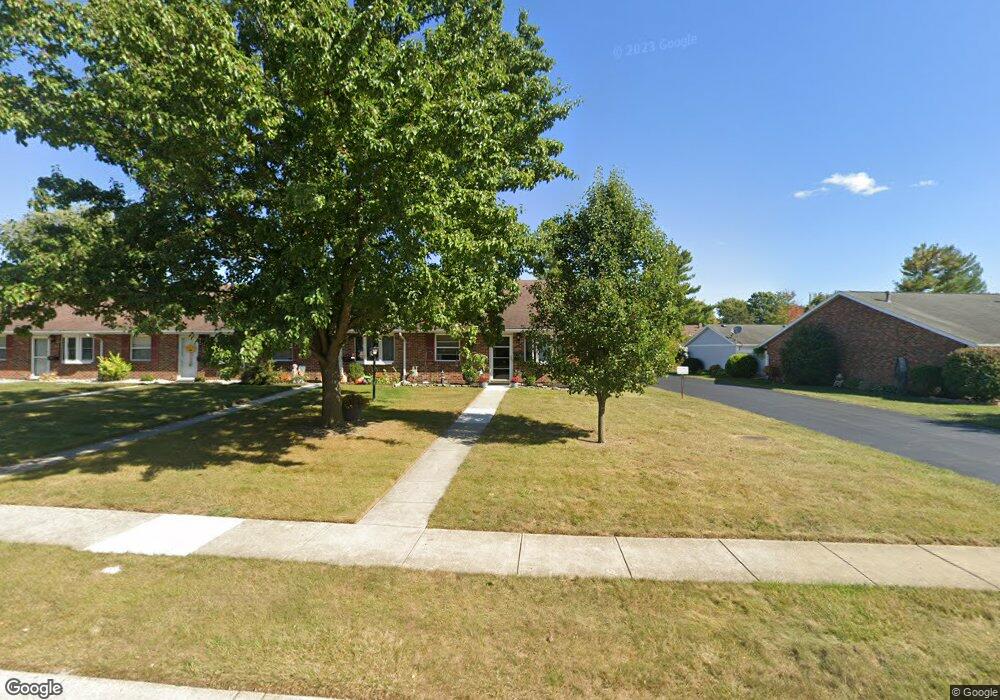
4600 Reno Ln Unit 1 Springfield, OH 45503
Estimated Value: $142,159 - $144,000
2
Beds
2
Baths
1,032
Sq Ft
$139/Sq Ft
Est. Value
About This Home
This home is located at 4600 Reno Ln Unit 1, Springfield, OH 45503 and is currently estimated at $143,290, approximately $138 per square foot. 4600 Reno Ln Unit 1 is a home located in Clark County with nearby schools including Northridge Elementary School, Kenton Ridge Middle & High School, and Emmanuel Christian Academy.
Ownership History
Date
Name
Owned For
Owner Type
Purchase Details
Closed on
Oct 17, 2003
Sold by
Foulk Kathryn M
Bought by
Dean Brenda J
Current Estimated Value
Home Financials for this Owner
Home Financials are based on the most recent Mortgage that was taken out on this home.
Original Mortgage
$64,400
Outstanding Balance
$29,902
Interest Rate
6.49%
Mortgage Type
Purchase Money Mortgage
Estimated Equity
$113,388
Purchase Details
Closed on
Sep 21, 2001
Sold by
Shatto James L and Shatto Denise J
Bought by
Foulk Kathryn M
Home Financials for this Owner
Home Financials are based on the most recent Mortgage that was taken out on this home.
Original Mortgage
$75,050
Interest Rate
7.06%
Purchase Details
Closed on
Oct 22, 1997
Sold by
Woodland Melissa A
Bought by
Shatto James L and Shatto Denise J
Purchase Details
Closed on
Sep 5, 1995
Sold by
Hoppes Builders & Dev Co
Bought by
Melissa A Woodland
Create a Home Valuation Report for This Property
The Home Valuation Report is an in-depth analysis detailing your home's value as well as a comparison with similar homes in the area
Home Values in the Area
Average Home Value in this Area
Purchase History
We collect this data history from publicly available records. To have your information removed, we recommend requesting removal directly through your county’s website.
| Date | Buyer | Sale Price | Title Company |
|---|---|---|---|
| Dean Brenda J | $79,500 | -- | |
| Foulk Kathryn M | $79,000 | -- | |
| Shatto James L | $73,500 | -- | |
| Melissa A Woodland | $59,800 | -- |
Source: Public Records
Mortgage History
We collect this data history from publicly available records. To have your information removed, we recommend requesting removal directly through your county’s website.
| Date | Status | Borrower | Loan Amount |
|---|---|---|---|
| Open | Dean Brenda J | $64,400 | |
| Previous Owner | Foulk Kathryn M | $75,050 |
Source: Public Records
Tax History
| Year | Tax Paid | Tax Assessment Tax Assessment Total Assessment is a certain percentage of the fair market value that is determined by local assessors to be the total taxable value of land and additions on the property. | Land | Improvement |
|---|---|---|---|---|
| 2025 | $743 | $42,690 | $7,050 | $35,640 |
| 2024 | $745 | $26,800 | $5,730 | $21,070 |
| 2023 | $745 | $26,800 | $5,730 | $21,070 |
| 2022 | $766 | $26,800 | $5,730 | $21,070 |
| 2021 | $870 | $26,130 | $4,380 | $21,750 |
| 2020 | $871 | $26,130 | $4,380 | $21,750 |
| 2019 | $888 | $26,130 | $4,380 | $21,750 |
| 2018 | $757 | $22,970 | $5,250 | $17,720 |
| 2017 | $649 | $23,863 | $5,250 | $18,613 |
| 2016 | $644 | $23,863 | $5,250 | $18,613 |
| 2015 | $763 | $25,680 | $5,250 | $20,430 |
| 2014 | $763 | $25,680 | $5,250 | $20,430 |
| 2013 | $745 | $25,680 | $5,250 | $20,430 |
Source: Public Records
Map
Nearby Homes
- 4512 Ridgewood Rd E
- 4732 Lehigh Dr
- 4385 Helena Ct
- 4642 Laredo St
- 4250 Midfield St
- 1341 Student Ave
- 4528 W Ridgewood Rd
- 4917 Auston St
- 4898 Brannan Dr E
- 5195 Burton Dr
- 1415 Montego Dr
- 5235 Middle Urbana Rd
- 1309 Richmoor Rd
- 954 Forest Edge Ave
- 4931 Bosart Rd
- 4028 Ryland Dr Unit 4028
- 4008 Bosart Rd
- 1738 Berwick Dr Unit 107
- 1788 Berwick Dr
- 1503 Kingsgate Rd
- 4602 Reno Ln
- 4602 Reno Ln Unit 2
- 4604 Reno Ln
- 4606 Reno Ln Unit 4
- 4534 Reno Ln Unit 8
- 4608 Reno Ln Unit 5
- 4532 Reno Ln Unit 7
- 4610 Reno Ln Unit 6
- 4530 Reno Ln Unit 6
- 4612 Reno Ln
- 4528 Reno Ln Unit 5
- 4614 Reno Ln Unit 8
- 4601 Tulane Rd
- 4619 Reno Ln
- 4619 Reno Ln
- 4526 Reno Ln
- 4526 Reno Ln Unit 4
- 4607 Tulane Rd
- 4545 Tulane Rd
- 4524 Reno Ln
Your Personal Tour Guide
Ask me questions while you tour the home.