Estimated Value: $441,962 - $486,000
--
Bed
4
Baths
2,998
Sq Ft
$154/Sq Ft
Est. Value
About This Home
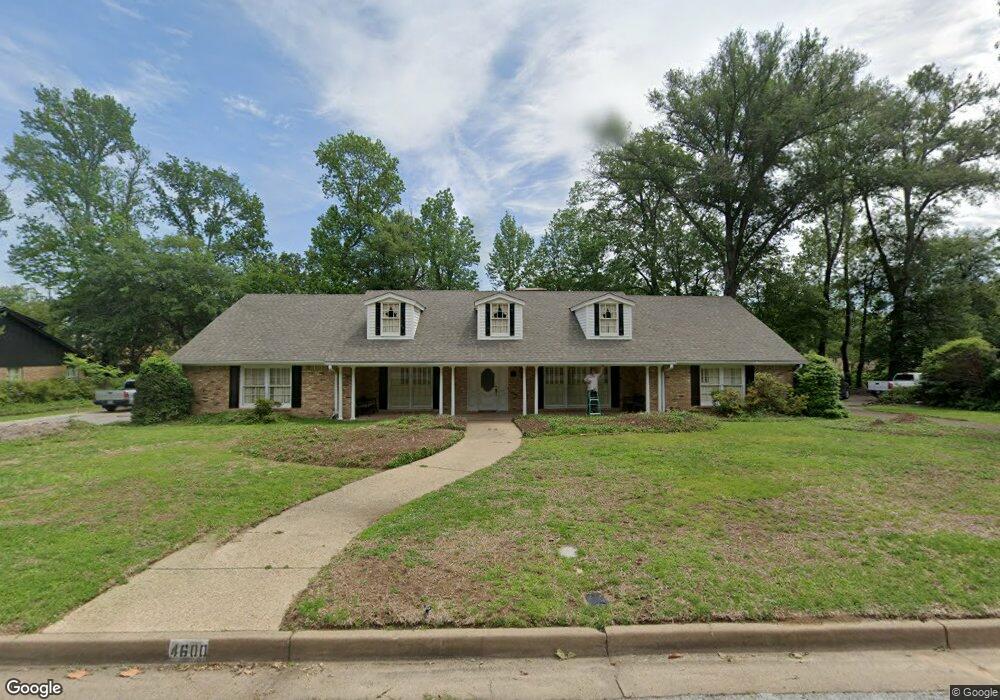
This home is located at 4600 Richmond Rd, Tyler, TX 75703 and is currently estimated at $462,741, approximately $154 per square foot. 4600 Richmond Rd is a home located in Smith County with nearby schools including Rice Elementary School, Hubbard Middle School, and Tyler Legacy High School.
Ownership History
Date
Name
Owned For
Owner Type
Purchase Details
Closed on
Oct 12, 2010
Sold by
Roach Peter John and Estate Of Lloyd Meyer Roach
Bought by
Roach Lloyd Andrew Andy and Roach Peter John
Current Estimated Value
Create a Home Valuation Report for This Property
The Home Valuation Report is an in-depth analysis detailing your home's value as well as a comparison with similar homes in the area
Home Values in the Area
Average Home Value in this Area
Purchase History
| Date | Buyer | Sale Price | Title Company |
|---|---|---|---|
| Roach Lloyd Andrew Andy | -- | None Available | |
| Roach Lloyd Andrew Andy | -- | None Available |
Source: Public Records
Tax History Compared to Growth
Tax History
| Year | Tax Paid | Tax Assessment Tax Assessment Total Assessment is a certain percentage of the fair market value that is determined by local assessors to be the total taxable value of land and additions on the property. | Land | Improvement |
|---|---|---|---|---|
| 2025 | $4,484 | $455,619 | $70,232 | $385,387 |
| 2024 | $4,484 | $404,461 | $66,176 | $396,051 |
| 2023 | $6,410 | $427,845 | $66,176 | $361,669 |
| 2022 | $6,549 | $360,269 | $60,799 | $299,470 |
| 2021 | $6,375 | $303,877 | $60,799 | $243,078 |
| 2020 | $6,202 | $290,479 | $60,799 | $229,680 |
| 2019 | $5,762 | $263,507 | $41,360 | $222,147 |
| 2018 | $5,721 | $263,030 | $41,360 | $221,670 |
| 2017 | $5,616 | $263,030 | $41,360 | $221,670 |
| 2016 | $5,408 | $253,310 | $41,360 | $211,950 |
| 2015 | $4,957 | $245,970 | $41,360 | $204,610 |
| 2014 | $4,957 | $239,348 | $41,360 | $197,988 |
Source: Public Records
Map
Nearby Homes
- 429 Holiday Ln
- 418 Boyd Ln
- 7434 Waterview Square
- 6052 N Park Central Ct
- 410 Brighton Ct
- 504 Woodland Hills Dr
- 704 Paloma St
- 5106 Cloverdale Dr
- 604-606 Woodland Hills Dr
- 601 Carriage Dr
- 11948 Gillian Ct
- 701 Woodland Hills Dr
- 3617 Jill Cir
- 612 Rosemont Place II
- 14237 County Road 192
- 14195 County Road 192
- 14245 County Road 192
- 815 Woodland Hills Dr
- 842 Carriage Dr
- 3829 Cloverdale Dr
- 4520 Richmond Rd
- 4610 Richmond Rd
- 4601 Leisure Ln
- 4601 4601 Leisure Ln
- 4525 Leisure Ln
- 4611 Leisure Ln
- 4515 Leisure Ln
- 600 Dorchester Dr
- 600 600 Dorchester
- 4511 Richmond Rd
- 4510 Richmond Rd
- 4611 Richmond Rd
- 4600 4600 Leisure
- 4621 Leisure Ln
- 4524 Leisure Ln
- 4600 Leisure Ln
- 4505 Leisure Ln
- 428 Holiday Ln
- 428 428 Holiday Ln
- 609 Dorchester Dr