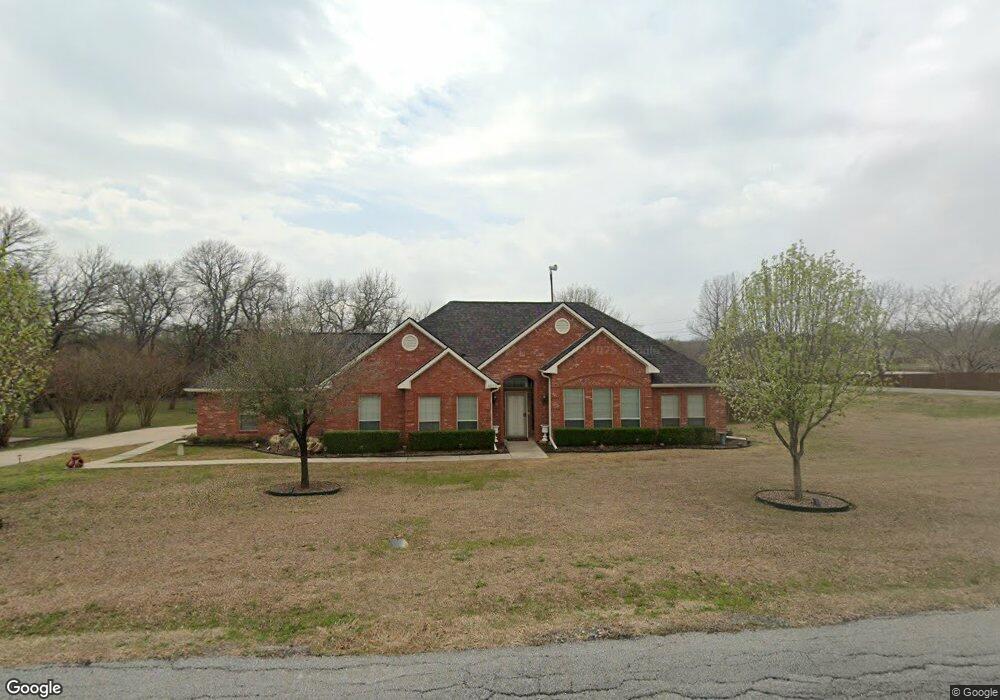
4600 Vista Lagos Dr Sherman, TX 75090
Estimated Value: $397,773 - $500,000
3
Beds
2
Baths
2,433
Sq Ft
$181/Sq Ft
Est. Value
About This Home
This home is located at 4600 Vista Lagos Dr, Sherman, TX 75090 and is currently estimated at $439,443, approximately $180 per square foot. 4600 Vista Lagos Dr is a home located in Grayson County with nearby schools including Percy W. Neblett Elementary School, Dillingham Intermediate School, and Piner Middle School.
Ownership History
Date
Name
Owned For
Owner Type
Purchase Details
Closed on
May 4, 2015
Sold by
Mcgehee Michael and Mcgehee Mindi
Bought by
Mahaffey Scott and Mahaffey Joyce
Current Estimated Value
Purchase Details
Closed on
Jan 17, 2007
Sold by
Gray Denis J and Gray Nancy H
Bought by
Mcgehee Michael and Mcgehee Mindi
Home Financials for this Owner
Home Financials are based on the most recent Mortgage that was taken out on this home.
Original Mortgage
$128,800
Interest Rate
6.09%
Mortgage Type
Purchase Money Mortgage
Purchase Details
Closed on
Mar 13, 2006
Sold by
Kemper Benny and Kemper Linda
Bought by
Gray Denis J and Gray Nancy H
Home Financials for this Owner
Home Financials are based on the most recent Mortgage that was taken out on this home.
Original Mortgage
$130,000
Interest Rate
6.19%
Mortgage Type
Construction
Create a Home Valuation Report for This Property
The Home Valuation Report is an in-depth analysis detailing your home's value as well as a comparison with similar homes in the area
Home Values in the Area
Average Home Value in this Area
Purchase History
| Date | Buyer | Sale Price | Title Company |
|---|---|---|---|
| Mahaffey Scott | -- | Chapin Title Co Inc | |
| Mcgehee Michael | -- | Red River Title Co | |
| Gray Denis J | -- | Red River Title Co |
Source: Public Records
Mortgage History
| Date | Status | Borrower | Loan Amount |
|---|---|---|---|
| Previous Owner | Mcgehee Michael | $128,800 | |
| Previous Owner | Gray Denis J | $130,000 |
Source: Public Records
Tax History Compared to Growth
Tax History
| Year | Tax Paid | Tax Assessment Tax Assessment Total Assessment is a certain percentage of the fair market value that is determined by local assessors to be the total taxable value of land and additions on the property. | Land | Improvement |
|---|---|---|---|---|
| 2025 | $3,735 | $386,916 | -- | -- |
| 2024 | $7,715 | $351,742 | $0 | $0 |
| 2023 | $3,654 | $319,765 | $0 | $0 |
| 2022 | $6,813 | $290,695 | $0 | $0 |
| 2021 | $6,624 | $264,268 | $31,409 | $232,859 |
| 2020 | $6,643 | $253,135 | $31,409 | $221,726 |
| 2019 | $7,045 | $261,362 | $32,213 | $229,149 |
| 2018 | $6,232 | $248,386 | $32,213 | $216,173 |
| 2017 | $5,778 | $232,099 | $32,213 | $199,886 |
| 2016 | $5,602 | $225,030 | $32,213 | $192,817 |
| 2015 | $4,089 | $186,435 | $14,318 | $172,117 |
| 2014 | $3,944 | $174,329 | $16,555 | $157,774 |
Source: Public Records
Map
Nearby Homes
- 4604 Bello Vista Cir
- 4517 Playa Ct
- 4605 Dripping Spring Rd
- TBD 1 Dripping Spring Rd
- 5585 S Fannin Ave
- 918 Cleve Cole
- 30 Tananger Springs Dr
- 257 Russell Ln
- 376 Tananger Springs Dr
- 2025 Woodlake Rd
- 327 Russell Ln
- 461 Cleve Cole Rd
- 492 Russell Ln
- 486 Cleve Cole Rd
- 3426 Tomahawk Dr
- 3417 Tomahawk Dr
- 3422 Tomahawk Dr
- 3413 Tomahawk Dr
- 3409 Tomahawk Dr
- 3405 Tomahawk Dr
- 4604 Vista Lagos Dr
- 4510 Vista Lagos Dr
- 5501 Camino Dos Lagos Dr
- 4605 Vista Lagos Dr
- 4521 Vista Lagos Dr
- 4608 Vista Lagos Dr
- 5404 Bello Vista Dr
- 5505 Camino Dos Lagos Dr
- 5320 Bello Vista Dr
- 5504 Camino Dos Lagos Dr
- 5408 Bello Vista Dr
- 4508 Vista Lagos Dr
- 4517 Vista Lagos Dr
- 5509 Camino Dos Lagos Dr
- 5409 Bello Vista Dr
- 5317 Bello Vista Dr
- 5401 Bello Vista Dr
- 5405 Bello Vista Dr
- 5313 Bello Vista Dr
- 5316 Bello Vista Dr