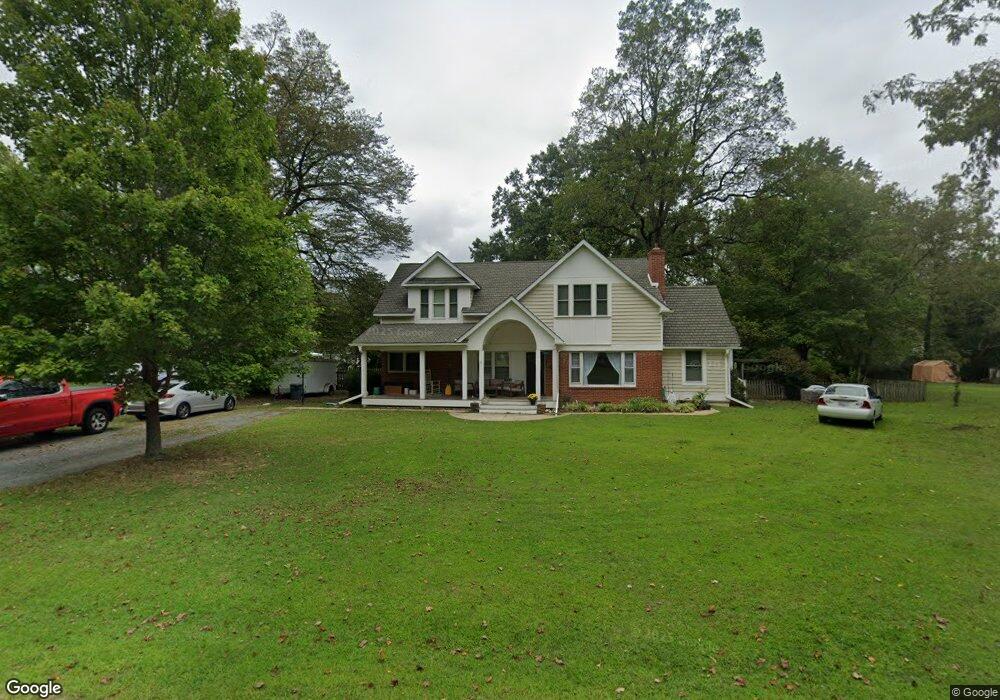
46002 Rolling Rd Lexington Park, MD 20653
Estimated Value: $413,000 - $744,000
--
Bed
1
Bath
3,735
Sq Ft
$147/Sq Ft
Est. Value
About This Home
This home is located at 46002 Rolling Rd, Lexington Park, MD 20653 and is currently estimated at $547,702, approximately $146 per square foot. 46002 Rolling Rd is a home located in St. Mary's County with nearby schools including Town Creek Elementary School, Esperanza Middle School, and Great Mills High School.
Ownership History
Date
Name
Owned For
Owner Type
Purchase Details
Closed on
Jul 30, 1992
Sold by
Smith Andrew
Bought by
Mesmer Lisa M and Mesmer Michael M
Current Estimated Value
Home Financials for this Owner
Home Financials are based on the most recent Mortgage that was taken out on this home.
Original Mortgage
$109,150
Interest Rate
8.08%
Purchase Details
Closed on
Dec 15, 1989
Sold by
Spencer Selden Joseph
Bought by
Smith Andrew
Home Financials for this Owner
Home Financials are based on the most recent Mortgage that was taken out on this home.
Original Mortgage
$95,950
Interest Rate
9.75%
Purchase Details
Closed on
Dec 20, 1983
Sold by
Crinigan Peter T
Bought by
Spencer Selden Joseph
Home Financials for this Owner
Home Financials are based on the most recent Mortgage that was taken out on this home.
Original Mortgage
$49,914
Interest Rate
13.42%
Create a Home Valuation Report for This Property
The Home Valuation Report is an in-depth analysis detailing your home's value as well as a comparison with similar homes in the area
Home Values in the Area
Average Home Value in this Area
Purchase History
| Date | Buyer | Sale Price | Title Company |
|---|---|---|---|
| Mesmer Lisa M | $114,900 | -- | |
| Smith Andrew | $95,000 | -- | |
| Spencer Selden Joseph | $59,900 | -- |
Source: Public Records
Mortgage History
| Date | Status | Borrower | Loan Amount |
|---|---|---|---|
| Closed | Mesmer Lisa M | $109,150 | |
| Previous Owner | Smith Andrew | $95,950 | |
| Previous Owner | Spencer Selden Joseph | $49,914 |
Source: Public Records
Tax History Compared to Growth
Tax History
| Year | Tax Paid | Tax Assessment Tax Assessment Total Assessment is a certain percentage of the fair market value that is determined by local assessors to be the total taxable value of land and additions on the property. | Land | Improvement |
|---|---|---|---|---|
| 2025 | $4,365 | $423,133 | $0 | $0 |
| 2024 | $4,228 | $400,467 | $0 | $0 |
| 2023 | $4,093 | $377,800 | $102,800 | $275,000 |
| 2022 | $4,034 | $372,367 | $0 | $0 |
| 2021 | $3,974 | $366,933 | $0 | $0 |
| 2020 | $3,915 | $361,500 | $102,800 | $258,700 |
| 2019 | $3,913 | $361,500 | $102,800 | $258,700 |
| 2018 | $3,911 | $361,500 | $102,800 | $258,700 |
| 2017 | $3,921 | $366,300 | $0 | $0 |
| 2016 | -- | $366,167 | $0 | $0 |
| 2015 | $1,894 | $366,033 | $0 | $0 |
| 2014 | $1,894 | $365,900 | $0 | $0 |
Source: Public Records
Map
Nearby Homes
- 46080 E Sunrise Dr
- 23495 River Rd
- 45855 W Sunrise Dr
- 23540 River Rd
- 23395 Esperanza Cir
- Lot 8 Lake Dr
- 23396 Esperanza Cir
- 23294 Esperanza Dr
- 23164 Mirfield Ln
- 23359 Patuxent View Rd
- 23181 Town Creek Dr
- 45991 Clarks Rd
- 23790 Saint Clair Rd
- 24250 N Patuxent Beach Rd
- 0 Kingston Creek Rd
- 0 Millstone Landing Rd Unit MDSM2016996
- 23665 Kingston Creek Rd
- 23499 Myrtle Point Rd
- 45493 Deer Crossing Ln
- 23531 Myrtle Point Rd
- 46014 Rolling Rd
- 45990 Rolling Rd
- 45990 Rolling Rd
- 46017 E Sunrise Dr
- 46005 E Sunrise Dr
- 45999 Rolling Rd
- 46028 Rolling Rd
- 45968 Rolling Rd
- 46027 E Sunrise Dr
- 46013 Rolling Rd
- 45989 Rolling Rd
- 45995 E Sunrise Dr
- 46019 Rolling Rd
- 46039 E Sunrise Dr
- 45975 Rolling Rd
- 45966 Rolling Rd
- 46044 Rolling Rd
- 45985 E Sunrise Dr
- 46049 E Sunrise Dr
- 18309 River Rd