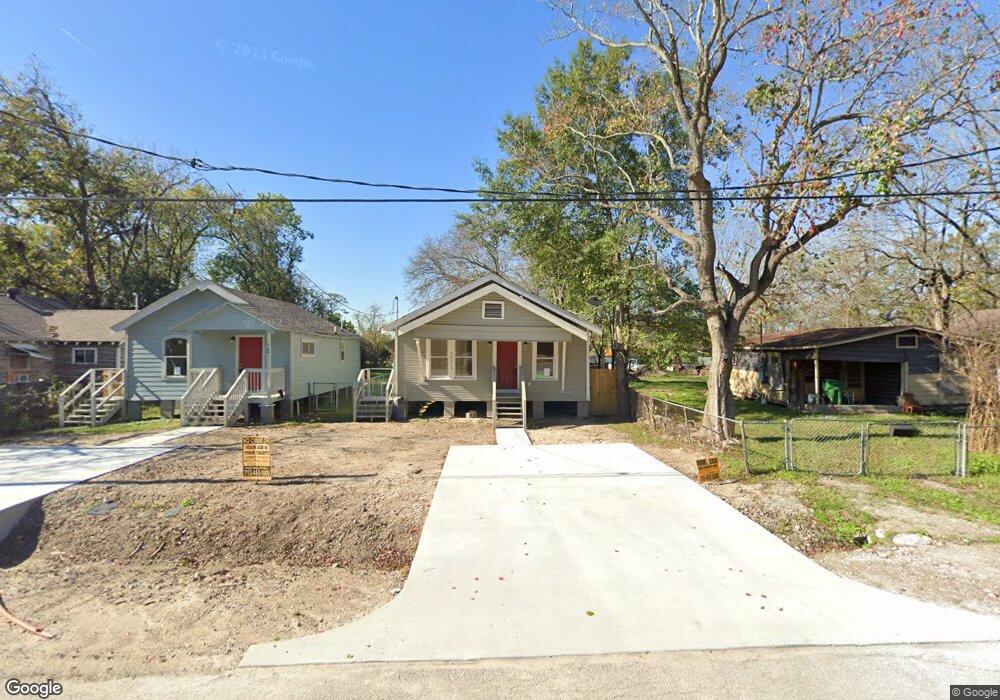
4601 Leffingwell St Unit A Houston, TX 77026
Kashmere Gardens NeighborhoodEstimated Value: $166,000 - $249,147
2
Beds
1
Bath
648
Sq Ft
$326/Sq Ft
Est. Value
About This Home
This home is located at 4601 Leffingwell St Unit A, Houston, TX 77026 and is currently estimated at $211,287, approximately $326 per square foot. 4601 Leffingwell St Unit A is a home located in Harris County with nearby schools including Kashmere Gardens Elementary School, Key Middle, and Kashmere High School.
Ownership History
Date
Name
Owned For
Owner Type
Purchase Details
Closed on
Mar 7, 2017
Sold by
Wizig Scott
Bought by
Aomej For Salc Llc
Current Estimated Value
Purchase Details
Closed on
Aug 3, 2010
Sold by
Homes For Sale Llc
Bought by
Baker Clifford
Home Financials for this Owner
Home Financials are based on the most recent Mortgage that was taken out on this home.
Original Mortgage
$79,000
Interest Rate
4.38%
Mortgage Type
Seller Take Back
Purchase Details
Closed on
Dec 30, 2009
Sold by
Avionn Daryl R and Jozwiak Robert Anthony
Bought by
Homes For Sale Llc
Purchase Details
Closed on
Mar 8, 2000
Sold by
Jozwiak Robert Anthony and Jozwiak Judy
Bought by
Avionn Daryl R
Home Financials for this Owner
Home Financials are based on the most recent Mortgage that was taken out on this home.
Original Mortgage
$77,720
Interest Rate
8.29%
Mortgage Type
Seller Take Back
Create a Home Valuation Report for This Property
The Home Valuation Report is an in-depth analysis detailing your home's value as well as a comparison with similar homes in the area
Home Values in the Area
Average Home Value in this Area
Purchase History
| Date | Buyer | Sale Price | Title Company |
|---|---|---|---|
| Aomej For Salc Llc | $18,100 | None Available | |
| Baker Clifford | -- | None Available | |
| Homes For Sale Llc | $8,000 | None Available | |
| Avionn Daryl R | -- | Houston Title Co |
Source: Public Records
Mortgage History
| Date | Status | Borrower | Loan Amount |
|---|---|---|---|
| Previous Owner | Baker Clifford | $79,000 | |
| Previous Owner | Avionn Daryl R | $77,720 |
Source: Public Records
Tax History Compared to Growth
Tax History
| Year | Tax Paid | Tax Assessment Tax Assessment Total Assessment is a certain percentage of the fair market value that is determined by local assessors to be the total taxable value of land and additions on the property. | Land | Improvement |
|---|---|---|---|---|
| 2025 | $4,880 | $141,534 | $57,035 | $84,499 |
| 2024 | $4,880 | $233,206 | $73,440 | $159,766 |
| 2023 | $4,880 | $236,942 | $67,200 | $169,742 |
| 2022 | $1,941 | $76,061 | $48,000 | $28,061 |
| 2021 | $1,553 | $66,619 | $33,600 | $33,019 |
| 2020 | $1,485 | $61,312 | $33,600 | $27,712 |
| 2019 | $962 | $37,999 | $19,200 | $18,799 |
| 2018 | $1,651 | $65,238 | $20,875 | $44,363 |
| 2017 | $1,650 | $65,238 | $20,875 | $44,363 |
| 2016 | $1,650 | $65,238 | $20,875 | $44,363 |
| 2015 | $1,157 | $45,000 | $16,700 | $28,300 |
| 2014 | $1,157 | $45,000 | $16,700 | $28,300 |
Source: Public Records
Map
Nearby Homes
- 4520 Falls St
- 4108 Falls St
- 0 Falls St
- 4501 Hirsch Rd
- 4502 Hirsch Rd Unit A
- 0001 Cavalcade St
- 3810a-b Cavalcade St
- 00 Los Angeles St
- 4513 Los Angeles St
- 3717 Sayers St
- 4305 Los Angeles St
- 4810 Hirsch Rd
- 4215 Los Angeles St
- 5914 Wayne St
- 4611 W Hunting St
- 4817 Los Angeles St
- 4819 Los Angeles St
- 0 Memel St
- 3418 Memel St
- 0 0 Scenic Rd
- 4601 Leffingwell St Unit B
- 4603 Leffingwell St
- 4517 Leffingwell St
- 4522 Falls St
- 4515 Leffingwell St
- 4605 Leffingwell St
- 4604 Leffingwell St
- 4609 Leffingwell St
- 4513 Leffingwell St
- 4602 Falls St
- 4602 Leffingwell St
- 4518 Falls St
- 4606 Falls St
- 4518 Leffingwell St
- 4510 Falls St
- 4606 Leffingwell St
- 4514 Leffingwell St
- 5026 Falls St
- 4503 Leffingwell St
- 4611 Leffingwell St