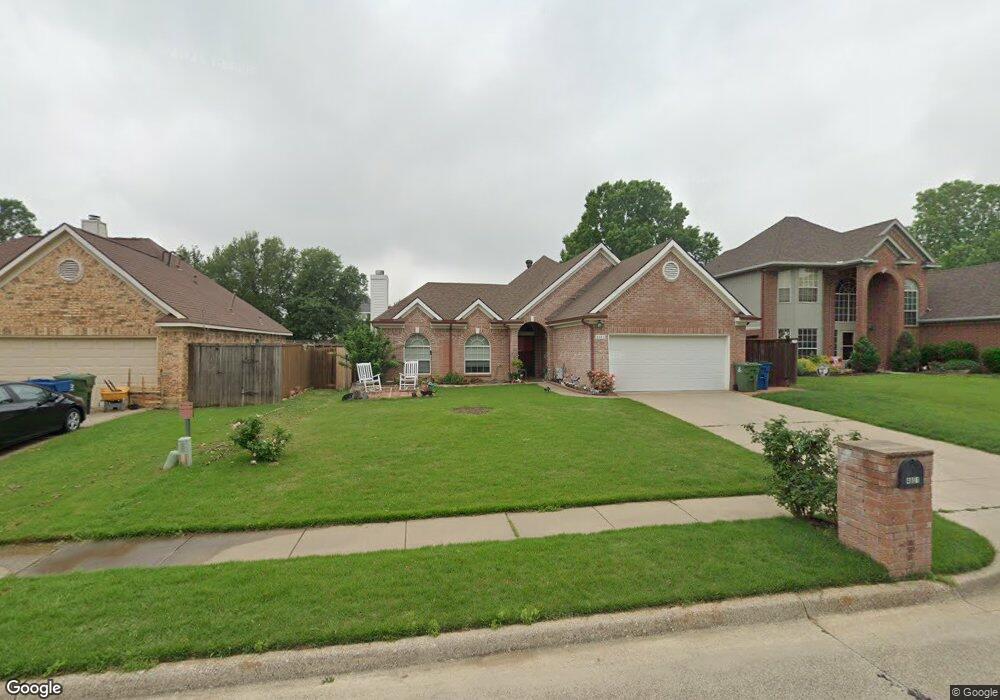
4601 Prescott Cir Flower Mound, TX 75028
Estimated Value: $375,470 - $389,000
3
Beds
2
Baths
1,453
Sq Ft
$264/Sq Ft
Est. Value
About This Home
This home is located at 4601 Prescott Cir, Flower Mound, TX 75028 and is currently estimated at $383,618, approximately $264 per square foot. 4601 Prescott Cir is a home located in Denton County with nearby schools including Timber Creek Elementary School, Lamar Middle School, and Marcus High School.
Ownership History
Date
Name
Owned For
Owner Type
Purchase Details
Closed on
Dec 14, 2017
Sold by
Weatherhead Jeremy H
Bought by
The Jeremy H And Jody K Weatherhead Revo
Current Estimated Value
Purchase Details
Closed on
Jun 2, 2015
Sold by
Eshe Linda C
Bought by
Novida Propertes Llc
Purchase Details
Closed on
Mar 22, 2004
Sold by
Ctx Mortgage Co
Bought by
Hud
Purchase Details
Closed on
Mar 8, 2002
Sold by
Jones Corby S and Jones Yvette K
Bought by
Cendant Mobility Financial Corp
Purchase Details
Closed on
Jan 5, 1999
Sold by
Randazzo Joseph C and Randazzo Cheryl A
Bought by
Ocwen Federal Bank Fsb and Berkeley Federal Bank & Trust Fsb
Purchase Details
Closed on
Jun 18, 1994
Sold by
Hartsell Daniel R and Hartsell Carla Anne
Bought by
Weatherhead Jeremy H
Home Financials for this Owner
Home Financials are based on the most recent Mortgage that was taken out on this home.
Original Mortgage
$74,800
Interest Rate
8.3%
Create a Home Valuation Report for This Property
The Home Valuation Report is an in-depth analysis detailing your home's value as well as a comparison with similar homes in the area
Home Values in the Area
Average Home Value in this Area
Purchase History
| Date | Buyer | Sale Price | Title Company |
|---|---|---|---|
| The Jeremy H And Jody K Weatherhead Revo | -- | None Available | |
| Novida Propertes Llc | $122,000 | None Available | |
| Hud | -- | -- | |
| Cendant Mobility Financial Corp | -- | -- | |
| Ocwen Federal Bank Fsb | $72,595 | -- | |
| Weatherhead Jeremy H | -- | -- |
Source: Public Records
Mortgage History
| Date | Status | Borrower | Loan Amount |
|---|---|---|---|
| Previous Owner | Weatherhead Jeremy H | $74,800 |
Source: Public Records
Tax History Compared to Growth
Tax History
| Year | Tax Paid | Tax Assessment Tax Assessment Total Assessment is a certain percentage of the fair market value that is determined by local assessors to be the total taxable value of land and additions on the property. | Land | Improvement |
|---|---|---|---|---|
| 2025 | $5,841 | $400,000 | $115,575 | $284,425 |
| 2024 | $5,841 | $345,000 | $115,575 | $229,425 |
| 2023 | $6,333 | $371,000 | $109,621 | $261,379 |
| 2022 | $5,968 | $321,000 | $89,700 | $231,300 |
| 2021 | $5,203 | $259,000 | $62,100 | $196,900 |
| 2020 | $5,202 | $260,189 | $62,100 | $198,089 |
| 2019 | $5,326 | $257,037 | $62,100 | $194,937 |
| 2018 | $5,078 | $243,650 | $62,100 | $181,550 |
| 2017 | $4,645 | $220,434 | $62,100 | $169,379 |
| 2016 | $4,243 | $195,108 | $45,540 | $161,124 |
| 2015 | $3,412 | $177,371 | $45,540 | $131,831 |
| 2014 | $3,412 | $166,072 | $45,540 | $120,532 |
| 2013 | -- | $158,535 | $45,540 | $112,995 |
Source: Public Records
Map
Nearby Homes
- 4525 Sandera Ln
- 4600 Oak Springs Dr
- 1717 Ingleside Dr
- 4218 Rollo Ct
- 1816 Newton Dr
- 1837 Meyerwood Ln N
- 3305 Voyager Ln
- 1222 Savannah Ct
- 1405 Timber Creek Rd
- 1204 Marcus Ct
- 4432 Villa Dr
- 1328 Superior Dr
- Columbia Plan at The River Walk - River Walk at Central Park
- Concord Plan at The River Walk - River Walk at Central Park
- Greenwich Plan at The River Walk - River Walk at Central Park
- 1105 Heiden Ct
- 5020 Timber Creek Rd
- 4004 Willow Run Dr
- 1916 Buckeye Dr
- 1037 Colony St
- 4517 Prescott Cir
- 4605 Prescott Cir
- 4600 Sandera Ln
- 4520 Sandera Ln
- 4513 Prescott Cir
- 4609 Prescott Cir
- 4604 Sandera Ln
- 4516 Sandera Ln
- 4600 Prescott Cir
- 4604 Prescott Cir
- 4608 Sandera Ln
- 4613 Prescott Cir
- 4509 Prescott Cir
- 4608 Prescott Cir
- 4512 Sandera Ln
- 4612 Sandera Ln
- 4612 Prescott Cir
- 4617 Prescott Cir
- 4505 Prescott Cir
- 4508 Sandera Ln