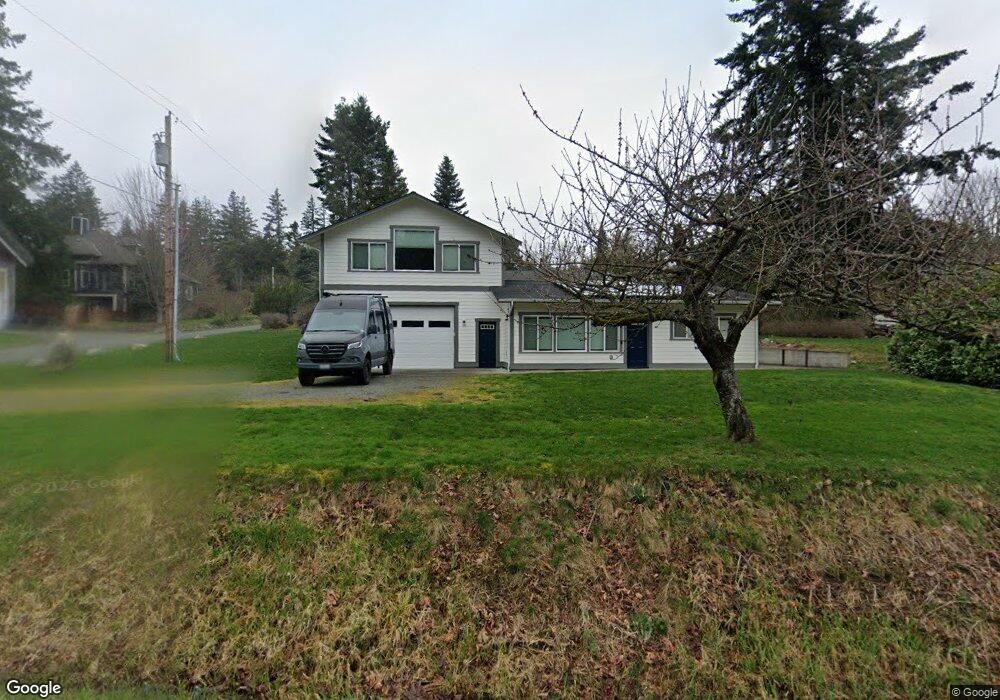
4601 Samish Way Bellingham, WA 98229
Samish NeighborhoodEstimated Value: $528,000 - $756,000
2
Beds
2
Baths
1,122
Sq Ft
$563/Sq Ft
Est. Value
About This Home
This home is located at 4601 Samish Way, Bellingham, WA 98229 and is currently estimated at $631,558, approximately $562 per square foot. 4601 Samish Way is a home located in Whatcom County with nearby schools including Wade King Elementary School, Fairhaven Middle School, and Sehome High School.
Ownership History
Date
Name
Owned For
Owner Type
Purchase Details
Closed on
Jun 22, 2022
Sold by
Scott Trow Jarod
Bought by
Trow Living Trust
Current Estimated Value
Purchase Details
Closed on
Oct 23, 2009
Sold by
Wood Darren W and Wood Sara E
Bought by
Trow Jarod
Home Financials for this Owner
Home Financials are based on the most recent Mortgage that was taken out on this home.
Original Mortgage
$189,000
Interest Rate
5.05%
Mortgage Type
New Conventional
Purchase Details
Closed on
Aug 27, 2004
Sold by
Holland Forest C and Holland Ruth E
Bought by
Wood Darren W and Wood Sara E
Home Financials for this Owner
Home Financials are based on the most recent Mortgage that was taken out on this home.
Original Mortgage
$156,000
Interest Rate
5.25%
Mortgage Type
Purchase Money Mortgage
Create a Home Valuation Report for This Property
The Home Valuation Report is an in-depth analysis detailing your home's value as well as a comparison with similar homes in the area
Home Values in the Area
Average Home Value in this Area
Purchase History
| Date | Buyer | Sale Price | Title Company |
|---|---|---|---|
| Trow Living Trust | -- | None Listed On Document | |
| Trow Jarod | $252,280 | Whatcom Land Title | |
| Wood Darren W | $195,000 | Whatcom Land Title |
Source: Public Records
Mortgage History
| Date | Status | Borrower | Loan Amount |
|---|---|---|---|
| Previous Owner | Trow Jarod | $189,000 | |
| Previous Owner | Wood Darren W | $156,000 | |
| Closed | Wood Darren W | $29,250 |
Source: Public Records
Tax History Compared to Growth
Tax History
| Year | Tax Paid | Tax Assessment Tax Assessment Total Assessment is a certain percentage of the fair market value that is determined by local assessors to be the total taxable value of land and additions on the property. | Land | Improvement |
|---|---|---|---|---|
| 2024 | $4,429 | $549,334 | $253,410 | $295,924 |
| 2023 | $4,429 | $568,974 | $262,470 | $306,504 |
| 2022 | $3,627 | $484,236 | $223,380 | $260,856 |
| 2021 | $3,371 | $390,523 | $180,150 | $210,373 |
| 2020 | $3,311 | $342,561 | $158,025 | $184,536 |
| 2019 | $2,979 | $325,165 | $150,000 | $175,165 |
| 2018 | $3,093 | $293,322 | $126,945 | $166,377 |
| 2017 | $2,725 | $260,364 | $112,680 | $147,684 |
| 2016 | $2,482 | $239,754 | $103,680 | $136,074 |
| 2015 | $2,443 | $227,388 | $98,280 | $129,108 |
| 2014 | -- | $216,554 | $93,600 | $122,954 |
| 2013 | -- | $153,322 | $90,000 | $63,322 |
Source: Public Records
Map
Nearby Homes
- 2600 42nd
- 2608 S 42nd St
- 2604 S 42nd St
- 4203 Harrison St
- 2500 Samish Way Unit 50
- 2500 Samish Way Unit 13
- 2010 Samish Crest Way
- 1912 S Colby Ct
- 4915 Samish Way Unit 60
- 4915 Samish Way Unit 66
- 955 Colony Ct
- 1800 40th Place
- 750 Samish Way
- 4949 Samish Way Unit 6
- 1615 Samish Way
- 1758 Old Samish Rd
- 3204 30th St
- 2815 Willis St
- 921 Whitewater Dr
- 3104 Wilson Ave
- 2721 46th St
- 4518 College St
- 2710 46th St
- 4512 College St
- 4700 College St
- 2615 46th St
- 4611 College St
- 4508 College St
- 2614 46th St
- 4703 College St
- 4715 S Samish Way
- 0 NHN 46th
- 4511 College St
- 4707 College St
- 2601 46th St
- 4715 Samish Way
- 4714 College St
- 0 Broad Unit 28124063
- 2606 46th St
- 4717 College St