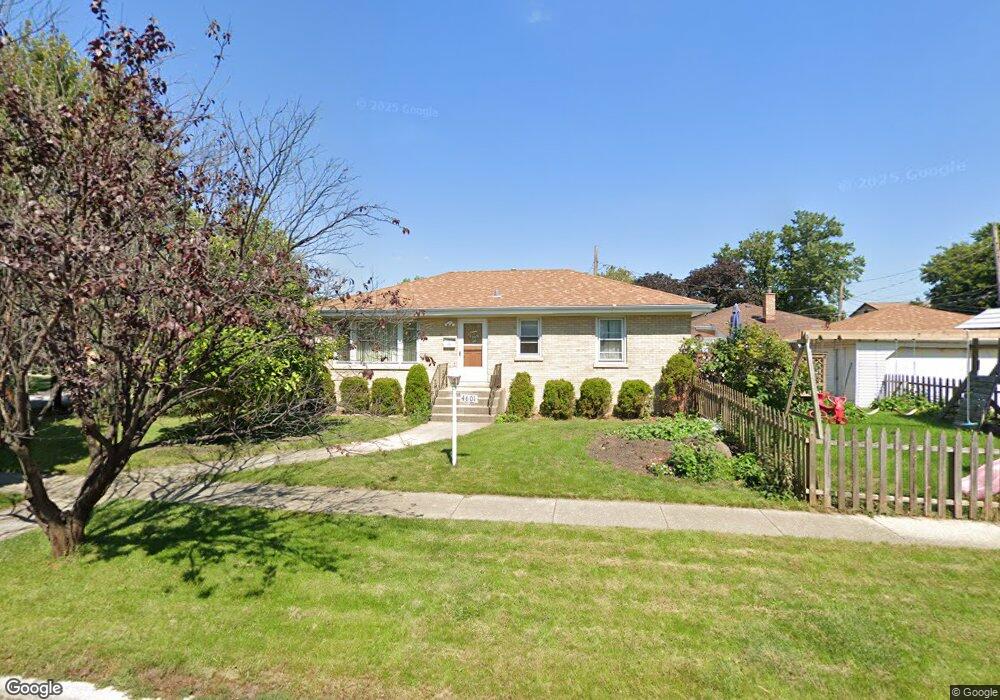
4601 Scott St Schiller Park, IL 60176
Estimated Value: $307,000 - $392,000
3
Beds
1
Bath
980
Sq Ft
$350/Sq Ft
Est. Value
About This Home
This home is located at 4601 Scott St, Schiller Park, IL 60176 and is currently estimated at $342,727, approximately $349 per square foot. 4601 Scott St is a home located in Cook County with nearby schools including John F Kennedy Elementary School, Washington Elementary School, and Lincoln Middle School.
Ownership History
Date
Name
Owned For
Owner Type
Purchase Details
Closed on
Nov 13, 2015
Sold by
Kafka Kenneth Edward and Kafka Victoria Leah
Bought by
Kafka Kenneth E and Kafka Livin L L
Current Estimated Value
Purchase Details
Closed on
Feb 19, 2009
Sold by
Kafka Kenneth E and Kafka Victoria Leah
Bought by
Kafka Kenneth Edward and Kafka Victoria Leah
Purchase Details
Closed on
Sep 16, 1998
Sold by
Anthony M Tamburo Sr 1997 Declaration Tr
Bought by
Kafka Kenneth E
Home Financials for this Owner
Home Financials are based on the most recent Mortgage that was taken out on this home.
Original Mortgage
$85,000
Outstanding Balance
$18,283
Interest Rate
6.98%
Estimated Equity
$324,444
Purchase Details
Closed on
Aug 25, 1997
Sold by
Tamburo Anthony M
Bought by
Decl Tamburo Sr Anthony M and Anthony M Tamburo Sr 1997 Declaration Tr
Create a Home Valuation Report for This Property
The Home Valuation Report is an in-depth analysis detailing your home's value as well as a comparison with similar homes in the area
Home Values in the Area
Average Home Value in this Area
Purchase History
| Date | Buyer | Sale Price | Title Company |
|---|---|---|---|
| Kafka Kenneth E | -- | Attorney | |
| Kafka Kenneth Edward | -- | Multiple | |
| Kafka Kenneth E | $147,000 | -- | |
| Decl Tamburo Sr Anthony M | -- | -- |
Source: Public Records
Mortgage History
| Date | Status | Borrower | Loan Amount |
|---|---|---|---|
| Open | Kafka Kenneth E | $85,000 |
Source: Public Records
Tax History Compared to Growth
Tax History
| Year | Tax Paid | Tax Assessment Tax Assessment Total Assessment is a certain percentage of the fair market value that is determined by local assessors to be the total taxable value of land and additions on the property. | Land | Improvement |
|---|---|---|---|---|
| 2024 | $7,303 | $26,000 | $5,897 | $20,103 |
| 2023 | $7,268 | $26,000 | $5,897 | $20,103 |
| 2022 | $7,268 | $26,000 | $5,897 | $20,103 |
| 2021 | $5,764 | $18,366 | $4,258 | $14,108 |
| 2020 | $5,603 | $18,366 | $4,258 | $14,108 |
| 2019 | $5,442 | $20,706 | $4,258 | $16,448 |
| 2018 | $5,565 | $19,023 | $3,603 | $15,420 |
| 2017 | $5,572 | $19,023 | $3,603 | $15,420 |
| 2016 | $5,535 | $19,023 | $3,603 | $15,420 |
| 2015 | $5,803 | $18,881 | $3,276 | $15,605 |
| 2014 | $5,777 | $18,881 | $3,276 | $15,605 |
| 2013 | $5,553 | $18,881 | $3,276 | $15,605 |
Source: Public Records
Map
Nearby Homes
- 9945 Sunnyside Ave
- 10004 Agatite Ave
- 9858 Montrose Ave
- 4348 Ruby St
- 4305 Judd Ave
- 9912 Irving Park Rd
- 4816 Michigan Ave
- 4228 Atlantic Ave
- 9740 Linn Ave
- 4608 Wesley Terrace
- 4438 Wesley Terrace
- 9514 Lawrence Ave Unit 2105
- 9514 Lawrence Ave Unit 2106
- 9514 Lawrence Ave Unit 2204
- 5010 Harold Ave
- 5047 Forster Ave
- 4012 Wagner Ave
- 4034 Denley Ave
- 4008 Wagner Ave
- 9355 Irving Park Rd Unit 522
- 9923 Eastwood Ct
- 9976 Wilson Ave
- 4607 Scott St
- 9970 Wilson Ave
- 4567 Scott St
- 9979 Wilson Ave
- 9919 Eastwood Ct
- 9973 Wilson Ave
- 4604 Scott St
- 4608 Scott St
- 4600 Scott St
- 4612 Scott St
- 9967 Wilson Ave
- 4580 Scott St
- 9960 Wilson Ave
- 9913 Eastwood Ct
- 4614 Scott St
- 4561 Scott St
- 4612 Hirschberg Ave
- 4576 Scott St