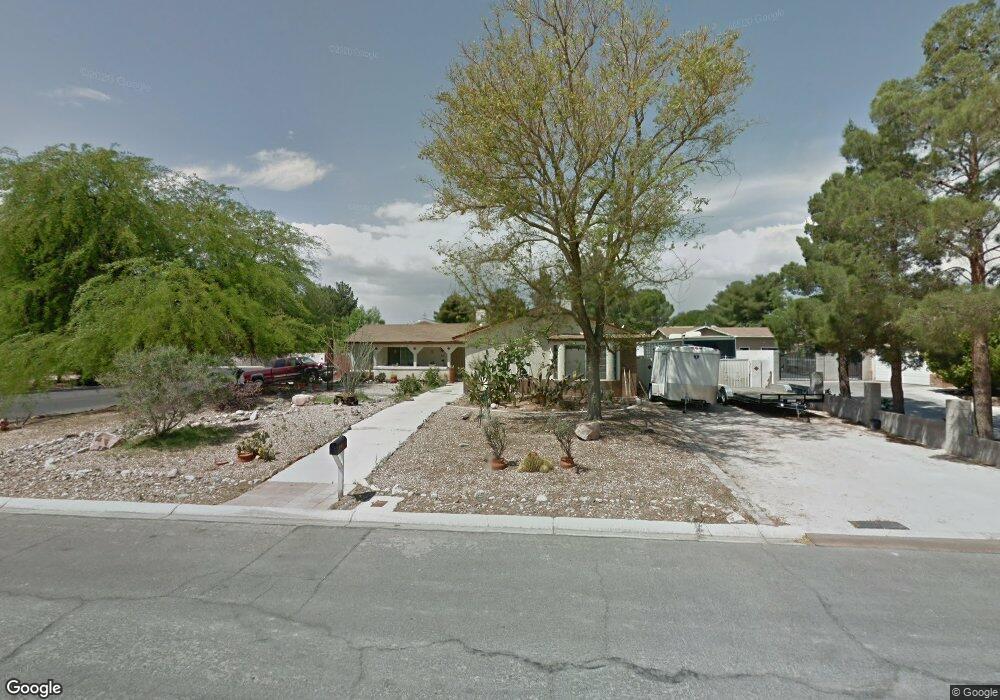
4601 Wheatley Ct North Las Vegas, NV 89031
Craig Ranch NeighborhoodEstimated Value: $392,000 - $540,000
4
Beds
2
Baths
1,356
Sq Ft
$355/Sq Ft
Est. Value
About This Home
This home is located at 4601 Wheatley Ct, North Las Vegas, NV 89031 and is currently estimated at $480,832, approximately $354 per square foot. 4601 Wheatley Ct is a home located in Clark County with nearby schools including Addeliar Guy Elementary School, Eva Wolfe Elementary School, and Theron L Swainston Middle School.
Ownership History
Date
Name
Owned For
Owner Type
Purchase Details
Closed on
Jun 26, 2003
Sold by
Humes David R and Humes Catherine B
Bought by
Leal Hector R and Leal Yolanda E
Current Estimated Value
Home Financials for this Owner
Home Financials are based on the most recent Mortgage that was taken out on this home.
Original Mortgage
$141,600
Outstanding Balance
$60,020
Interest Rate
5.22%
Mortgage Type
Unknown
Estimated Equity
$420,812
Purchase Details
Closed on
Jun 10, 2003
Sold by
Leal Hector R and Leal Yolanda E
Bought by
Ogle James
Home Financials for this Owner
Home Financials are based on the most recent Mortgage that was taken out on this home.
Original Mortgage
$141,600
Outstanding Balance
$60,020
Interest Rate
5.22%
Mortgage Type
Unknown
Estimated Equity
$420,812
Create a Home Valuation Report for This Property
The Home Valuation Report is an in-depth analysis detailing your home's value as well as a comparison with similar homes in the area
Home Values in the Area
Average Home Value in this Area
Purchase History
| Date | Buyer | Sale Price | Title Company |
|---|---|---|---|
| Leal Hector R | $177,000 | Old Republic Title Company | |
| Ogle James | $192,000 | Old Republic Title Company |
Source: Public Records
Mortgage History
| Date | Status | Borrower | Loan Amount |
|---|---|---|---|
| Open | Leal Hector R | $141,600 | |
| Closed | Ogle James | $153,600 | |
| Closed | Ogle James | $19,200 |
Source: Public Records
Tax History Compared to Growth
Tax History
| Year | Tax Paid | Tax Assessment Tax Assessment Total Assessment is a certain percentage of the fair market value that is determined by local assessors to be the total taxable value of land and additions on the property. | Land | Improvement |
|---|---|---|---|---|
| 2025 | $2,294 | $99,040 | $46,550 | $52,490 |
| 2024 | $2,125 | $99,040 | $46,550 | $52,490 |
| 2023 | $1,415 | $88,634 | $38,500 | $50,134 |
| 2022 | $1,968 | $79,538 | $33,250 | $46,288 |
| 2021 | $1,822 | $71,288 | $26,950 | $44,338 |
| 2020 | $1,689 | $71,323 | $26,950 | $44,373 |
| 2019 | $1,583 | $68,394 | $24,500 | $43,894 |
| 2018 | $1,511 | $66,613 | $23,800 | $42,813 |
| 2017 | $2,104 | $62,714 | $18,900 | $43,814 |
| 2016 | $1,415 | $59,712 | $13,300 | $46,412 |
| 2015 | $1,411 | $40,812 | $10,500 | $30,312 |
| 2014 | $1,370 | $42,762 | $10,500 | $32,262 |
Source: Public Records
Map
Nearby Homes
- 4633 Lost Creek Ct
- 4508 San Mateo St
- 4745 Gunlock Cir
- 4529 Point Breeze Dr
- 4341 San Mateo St
- 4800 Baffin Ct
- 4336 Shannon Valley Ave
- 4413 Summer Glen Ln
- 5004 Camino Del Rancho
- 4537 Colonial Canyon St
- 5104 Brookmere Dr
- 4319 Basil Leaf Ave
- 4508 W San Miguel Ave
- 4216 N Decatur Blvd
- 4708 English Ivy Ct
- 4427 Pageantry Falls Dr
- 4006 Clove Tree Ct
- 4230 Valley Spruce Way
- 4001 Clove Tree Ct
- 4613 Rachel Ann Ave
- 4609 Wheatley Ct
- 4412 Cayuse St
- 4617 Wheatley Ct
- 4445 W Red Coach Ave
- 4437 W Red Coach Ave
- 4600 Wheatley Ct
- 4601 Pacer Ave
- 4420 Cayuse St
- 4608 Wheatley Ct
- 4512 Black Stallion Ave
- 4538 Dusty Trail St
- 4431 W Red Coach Ave
- 4625 Wheatley Ct
- 4616 Wheatley Ct
- 4428 Cayuse St
- 4425 W Red Coach Ave
- 4530 San Mateo St Unit 4
- 4624 Wheatley Ct
- 4609 Pacer Ave
- 4530 Dusty Trail St