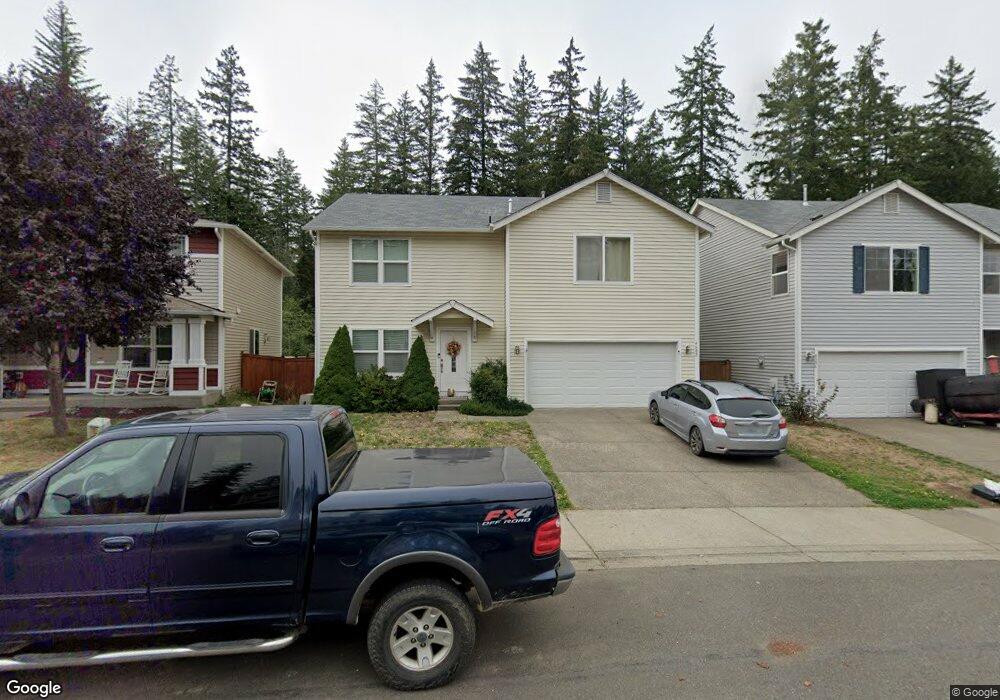
4602 Chanting Cir SW Port Orchard, WA 98367
McCormick Woods NeighborhoodEstimated Value: $562,409 - $620,000
3
Beds
2
Baths
2,468
Sq Ft
$238/Sq Ft
Est. Value
About This Home
This home is located at 4602 Chanting Cir SW, Port Orchard, WA 98367 and is currently estimated at $586,352, approximately $237 per square foot. 4602 Chanting Cir SW is a home located in Kitsap County with nearby schools including Sunnyslope Elementary School, Cedar Heights Middle School, and South Kitsap High School.
Ownership History
Date
Name
Owned For
Owner Type
Purchase Details
Closed on
Mar 30, 2018
Sold by
Gardiner Garrett B and Gardiner Sandra M
Bought by
Ransier Mary and Garrett Travis
Current Estimated Value
Home Financials for this Owner
Home Financials are based on the most recent Mortgage that was taken out on this home.
Original Mortgage
$342,202
Interest Rate
4.4%
Mortgage Type
VA
Purchase Details
Closed on
Oct 25, 2010
Sold by
The Quadrant Corporation
Bought by
Gardiner Garrett B and Gardiner Sandra M
Home Financials for this Owner
Home Financials are based on the most recent Mortgage that was taken out on this home.
Original Mortgage
$276,750
Interest Rate
4.33%
Mortgage Type
VA
Create a Home Valuation Report for This Property
The Home Valuation Report is an in-depth analysis detailing your home's value as well as a comparison with similar homes in the area
Home Values in the Area
Average Home Value in this Area
Purchase History
| Date | Buyer | Sale Price | Title Company |
|---|---|---|---|
| Ransier Mary | $335,000 | Attorney Title | |
| Gardiner Garrett B | $271,230 | First American Title Ins |
Source: Public Records
Mortgage History
| Date | Status | Borrower | Loan Amount |
|---|---|---|---|
| Open | Ransier Mary | $342,202 | |
| Previous Owner | Gardiner Garrett B | $276,750 |
Source: Public Records
Tax History Compared to Growth
Tax History
| Year | Tax Paid | Tax Assessment Tax Assessment Total Assessment is a certain percentage of the fair market value that is determined by local assessors to be the total taxable value of land and additions on the property. | Land | Improvement |
|---|---|---|---|---|
| 2026 | $4,181 | $445,000 | $96,390 | $348,610 |
| 2025 | $4,181 | $479,200 | $97,590 | $381,610 |
| 2024 | $4,036 | $479,200 | $97,590 | $381,610 |
| 2023 | $4,033 | $479,200 | $97,590 | $381,610 |
| 2022 | $4,016 | $401,680 | $88,510 | $313,170 |
| 2021 | $3,924 | $372,050 | $81,700 | $290,350 |
| 2020 | $3,755 | $345,260 | $75,650 | $269,610 |
| 2019 | $3,068 | $308,790 | $65,350 | $243,440 |
| 2018 | $3,419 | $276,180 | $58,270 | $217,910 |
| 2017 | $3,026 | $276,180 | $58,270 | $217,910 |
| 2016 | $3,062 | $258,750 | $54,460 | $204,290 |
| 2015 | $2,953 | $253,640 | $54,460 | $199,180 |
| 2014 | -- | $248,530 | $54,460 | $194,070 |
| 2013 | -- | $225,120 | $51,440 | $173,680 |
Source: Public Records
Map
Nearby Homes
- 4632 Chanting Cir SW
- 2755 SW Jabirin Way
- 4821 Amherst Way SW
- 4281 Wandering Way
- 3932 McCormick Village Dr Unit 27
- 3936 McCormick Village Dr Unit 28
- 4886 Amherst Way SW
- 4171 Wandering Way
- 4131 Wandering Way
- 0 Lot 2 McCormick Village Dr
- 4111 Wandering Way
- 3315 SW Mooring Ln
- 4101 Wandering Way
- 4091 Wandering Way
- 4051 Wandering Way
- 4071 Wandering Way
- 4452 Explorer Ave
- 4382 Wigeon Ave SW
- 4244 SW Rustler St
- Camano Next Gen-Signature Plan at McCormick Trails - McCormick
- 4596 Chanting Cir SW
- 4614 Chanting Cir SW
- 4590 Chanting Cir SW
- 4620 Chanting Cir SW
- 4584 Chanting Cir SW
- 4164 Chanting Cir SW
- 4146 Chanting Cir SW
- 4578 Chanting Cir SW
- 4626 Chanting Cir SW
- 4140 Chanting Cir SW
- 4170 Chanting Cir SW
- 4132 Chanting Cir SW
- 4134 Chanting Cir SW
- 4572 Chanting Cir SW
- 4128 Chanting Cir SW
- 4638 Chanting Cir SW
- 4566 Chanting Cir SW