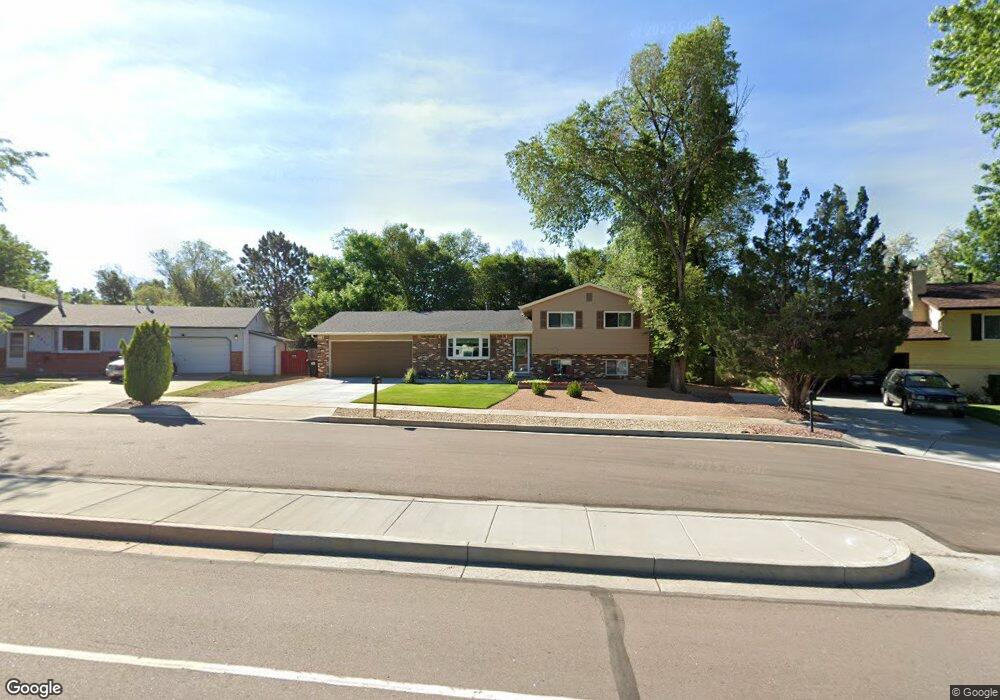
4603 Flintridge Dr Colorado Springs, CO 80918
Garden Ranch NeighborhoodEstimated Value: $409,821 - $428,000
3
Beds
2
Baths
1,103
Sq Ft
$379/Sq Ft
Est. Value
About This Home
This home is located at 4603 Flintridge Dr, Colorado Springs, CO 80918 and is currently estimated at $417,705, approximately $378 per square foot. 4603 Flintridge Dr is a home located in El Paso County with nearby schools including Grant Elementary School, Mann Middle School, and Mitchell High School.
Ownership History
Date
Name
Owned For
Owner Type
Purchase Details
Closed on
Jan 13, 2017
Sold by
Hendrickson Nels M and Hendrickson Melaine A
Bought by
Scott Cynthia A and Scott Roger L
Current Estimated Value
Purchase Details
Closed on
Aug 22, 2000
Sold by
Brunk Thomas J and Brunk Brenda M
Bought by
Hendrickson Nels M and Hendrickson Melanie A
Home Financials for this Owner
Home Financials are based on the most recent Mortgage that was taken out on this home.
Original Mortgage
$115,920
Interest Rate
8.15%
Purchase Details
Closed on
May 5, 2000
Sold by
Mcconnell Sheryl L and Mcconnell Gibson
Bought by
Brunk Thomas J and Brunk Brenda M
Home Financials for this Owner
Home Financials are based on the most recent Mortgage that was taken out on this home.
Original Mortgage
$120,967
Interest Rate
8.18%
Purchase Details
Closed on
Jul 15, 1994
Sold by
Beckmann Sheryl L
Bought by
Mcconnell Sheryl L and Mcconnell Gibson
Create a Home Valuation Report for This Property
The Home Valuation Report is an in-depth analysis detailing your home's value as well as a comparison with similar homes in the area
Home Values in the Area
Average Home Value in this Area
Purchase History
| Date | Buyer | Sale Price | Title Company |
|---|---|---|---|
| Scott Cynthia A | $222,000 | Empire Title Colorado Spring | |
| Hendrickson Nels M | $144,900 | Stewart Title | |
| Brunk Thomas J | $120,500 | Stewart Title | |
| Mcconnell Sheryl L | -- | -- |
Source: Public Records
Mortgage History
| Date | Status | Borrower | Loan Amount |
|---|---|---|---|
| Previous Owner | Hendrickson Nels M | $115,920 | |
| Previous Owner | Brunk Thomas J | $120,967 | |
| Closed | Hendrickson Nels M | $14,490 |
Source: Public Records
Tax History Compared to Growth
Tax History
| Year | Tax Paid | Tax Assessment Tax Assessment Total Assessment is a certain percentage of the fair market value that is determined by local assessors to be the total taxable value of land and additions on the property. | Land | Improvement |
|---|---|---|---|---|
| 2025 | $1,310 | $28,750 | -- | -- |
| 2024 | $1,197 | $27,980 | $4,820 | $23,160 |
| 2022 | $1,126 | $20,130 | $3,610 | $16,520 |
| 2021 | $1,223 | $20,720 | $3,720 | $17,000 |
| 2020 | $1,144 | $16,850 | $3,220 | $13,630 |
| 2019 | $1,137 | $16,850 | $3,220 | $13,630 |
| 2018 | $1,020 | $13,900 | $2,160 | $11,740 |
| 2017 | $966 | $13,900 | $2,160 | $11,740 |
| 2016 | $790 | $13,620 | $2,230 | $11,390 |
| 2015 | $787 | $13,620 | $2,230 | $11,390 |
| 2014 | $738 | $12,270 | $2,230 | $10,040 |
Source: Public Records
Map
Nearby Homes
- 4434 Misty Dr
- 4410 Moonlight Dr
- 4518 Misty Dr
- 4454 Ranch Cir
- 2832 Ridgeglen Way
- 5030 El Camino Dr Unit 8
- 5030 El Camino Dr Unit 1
- 4858 Sonata Dr Unit D
- 5034 El Camino Dr Unit 36
- 5034 El Camino Dr Unit 31
- 5034 El Camino Dr Unit 42
- 4886 Sonata Dr Unit C
- 4623 Ranch Cir
- 4853 Sonata Dr Unit C
- 4742 Villa Cir Unit A
- 4911 Sonata Dr
- 3710 Windflower Cir
- 4506 Ridgecrest Dr
- 5015 Bonita Way
- 4806 Sprucewood Dr
- 4607 Flintridge Dr
- 4519 Flintridge Dr
- 4430 Misty Dr
- 4438 Misty Dr
- 4611 Flintridge Dr
- 4515 Flintridge Dr
- 4426 Misty Dr
- 4502 Misty Dr
- 4511 Flintridge Dr
- 4615 Flintridge Dr
- 2918 Flintridge Way
- 4422 Misty Dr
- 4608 Flintridge Dr
- 4506 Misty Dr
- 4667 Ridgeglen Rd
- 4432 Moonlight Dr
- 4431 Misty Dr
- 2919 Flintridge Way
- 4503 Misty Dr
- 4507 Flintridge Dr