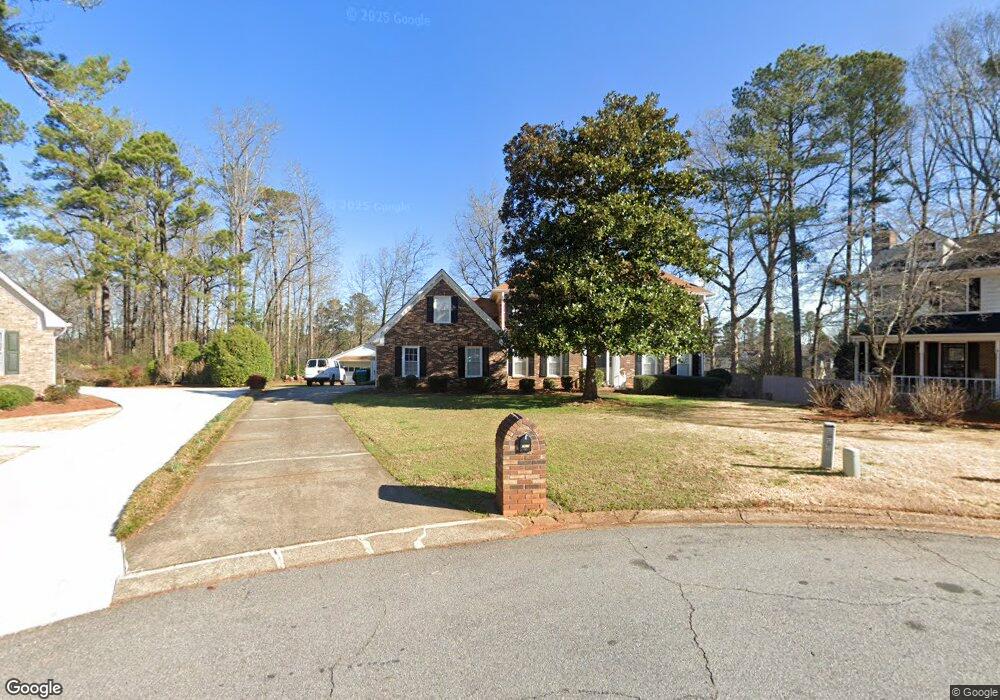
4603 Hancock Way SW Unit 23 Lilburn, GA 30047
Estimated Value: $493,000 - $557,000
4
Beds
3
Baths
2,688
Sq Ft
$192/Sq Ft
Est. Value
About This Home
This home is located at 4603 Hancock Way SW Unit 23, Lilburn, GA 30047 and is currently estimated at $514,990, approximately $191 per square foot. 4603 Hancock Way SW Unit 23 is a home located in Gwinnett County with nearby schools including Camp Creek Elementary School, Trickum Middle School, and Parkview High School.
Ownership History
Date
Name
Owned For
Owner Type
Purchase Details
Closed on
Jun 20, 2024
Sold by
Swaim Michael D
Bought by
Ledesma Ramos Guadalupe
Current Estimated Value
Home Financials for this Owner
Home Financials are based on the most recent Mortgage that was taken out on this home.
Original Mortgage
$408,000
Outstanding Balance
$402,344
Interest Rate
6.94%
Mortgage Type
New Conventional
Estimated Equity
$112,646
Purchase Details
Closed on
Jul 10, 2015
Sold by
Huang Warner J
Bought by
Swaim Michael D
Home Financials for this Owner
Home Financials are based on the most recent Mortgage that was taken out on this home.
Original Mortgage
$238,450
Interest Rate
4.08%
Mortgage Type
New Conventional
Create a Home Valuation Report for This Property
The Home Valuation Report is an in-depth analysis detailing your home's value as well as a comparison with similar homes in the area
Home Values in the Area
Average Home Value in this Area
Purchase History
| Date | Buyer | Sale Price | Title Company |
|---|---|---|---|
| Ledesma Ramos Guadalupe | $510,000 | -- | |
| Swaim Michael D | $251,000 | -- |
Source: Public Records
Mortgage History
| Date | Status | Borrower | Loan Amount |
|---|---|---|---|
| Open | Ledesma Ramos Guadalupe | $408,000 | |
| Previous Owner | Swaim Michael D | $238,450 |
Source: Public Records
Tax History Compared to Growth
Tax History
| Year | Tax Paid | Tax Assessment Tax Assessment Total Assessment is a certain percentage of the fair market value that is determined by local assessors to be the total taxable value of land and additions on the property. | Land | Improvement |
|---|---|---|---|---|
| 2025 | $6,783 | $180,640 | $36,000 | $144,640 |
| 2024 | $5,450 | $181,080 | $36,000 | $145,080 |
| 2023 | $5,450 | $146,040 | $29,600 | $116,440 |
| 2022 | $4,687 | $146,040 | $29,600 | $116,440 |
| 2021 | $4,334 | $125,720 | $29,600 | $96,120 |
| 2020 | $4,363 | $125,720 | $29,600 | $96,120 |
| 2019 | $4,093 | $119,200 | $25,600 | $93,600 |
| 2018 | $4,099 | $119,200 | $25,600 | $93,600 |
| 2016 | $3,710 | $100,400 | $20,000 | $80,400 |
| 2015 | $3,360 | $99,840 | $18,400 | $81,440 |
| 2014 | -- | $99,840 | $18,400 | $81,440 |
Source: Public Records
Map
Nearby Homes
- 1296 Mandalay Ct SW
- 1178 Carla Joe Dr SW
- 1296 Lake Lucerne Rd SW
- 1017 Rolling Forest Ln
- 1276 Hickory Dr SW
- 4662 Ridgeland Dr SW
- 4672 Ridgeland Dr SW
- 4671 Ridgeland Dr SW
- 1337 Arlene Ct SW
- 4327 Saint Michaels Dr SW
- 4449 Amberleaf Walk
- 1093 Hasty Ct SW
- 4665 Redspruce Dr SW
- 4271 Weston Dr SW
- 4702 Sequoia Dr SW
- 1348 Ridgewood Dr SW
- 954 Camp Creek Dr SW
- 1075 Westchester Dr SW
- 4603 Hancock Way SW
- 4613 Hancock Way SW
- 4593 Hancock Way SW Unit 1
- 4640 Admiral Ridge Way SW
- 4650 Admiral Ridge Way SW
- 4614 Jefferson Ln SW
- 4660 Admiral Ridge Way SW
- 4630 Admiral Ridge Way SW
- 4592 Hancock Way SW
- 4623 Hancock Way SW
- 4680 Admiral Ridge Way SW
- 4605 Jefferson Ln SW
- 1082 Bay Pointe Way SW
- 4645 Admiral Ridge Way SW
- 4624 Jefferson Ln SW
- 4612 Hancock Way SW Unit 1
- 4633 Hancock Way SW
- 1072 Bay Pointe Way SW
- 4665 Admiral Ridge Way SW
- 4690 Admiral Ridge Way SW