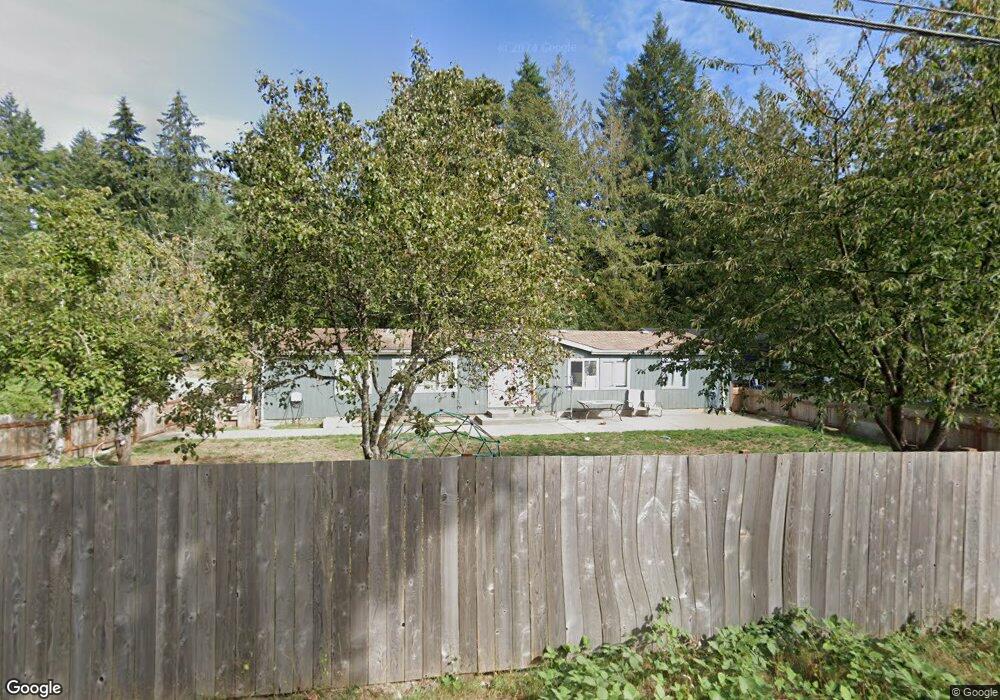
4603 SE Cavalry Way Port Orchard, WA 98367
Estimated Value: $496,000 - $571,000
2
Beds
2
Baths
2,506
Sq Ft
$208/Sq Ft
Est. Value
About This Home
This home is located at 4603 SE Cavalry Way, Port Orchard, WA 98367 and is currently estimated at $521,134, approximately $207 per square foot. 4603 SE Cavalry Way is a home located in Kitsap County with nearby schools including Mullenix Ridge Elementary School, John Sedgwick Middle School, and South Kitsap High School.
Ownership History
Date
Name
Owned For
Owner Type
Purchase Details
Closed on
Jan 29, 2025
Sold by
Stevens Matthew O and Stevens Christine L
Bought by
Campos Family Holdings Llc
Current Estimated Value
Home Financials for this Owner
Home Financials are based on the most recent Mortgage that was taken out on this home.
Original Mortgage
$291,500
Outstanding Balance
$289,703
Interest Rate
6.72%
Mortgage Type
Construction
Estimated Equity
$231,431
Purchase Details
Closed on
Dec 16, 2024
Sold by
Freeman Family Trust and Freeman Michael A
Bought by
Stevens Matthew O and Stevens Christine L
Home Financials for this Owner
Home Financials are based on the most recent Mortgage that was taken out on this home.
Original Mortgage
$291,500
Outstanding Balance
$289,703
Interest Rate
6.72%
Mortgage Type
Construction
Estimated Equity
$231,431
Purchase Details
Closed on
Jul 8, 2022
Sold by
Freeman Michael A
Bought by
Freeman Family Trust
Purchase Details
Closed on
Jan 14, 2015
Sold by
Freeman Michael A and Freeman Michele M
Bought by
Stevens Matthew O and Edwards Christine L
Create a Home Valuation Report for This Property
The Home Valuation Report is an in-depth analysis detailing your home's value as well as a comparison with similar homes in the area
Home Values in the Area
Average Home Value in this Area
Purchase History
| Date | Buyer | Sale Price | Title Company |
|---|---|---|---|
| Campos Family Holdings Llc | $200,000 | Ticor Title | |
| Stevens Matthew O | -- | None Listed On Document | |
| Freeman Family Trust | -- | -- | |
| Stevens Matthew O | $1,819 | None Available |
Source: Public Records
Mortgage History
| Date | Status | Borrower | Loan Amount |
|---|---|---|---|
| Open | Campos Family Holdings Llc | $291,500 | |
| Closed | Stevens Matthew O | $0 |
Source: Public Records
Tax History Compared to Growth
Tax History
| Year | Tax Paid | Tax Assessment Tax Assessment Total Assessment is a certain percentage of the fair market value that is determined by local assessors to be the total taxable value of land and additions on the property. | Land | Improvement |
|---|---|---|---|---|
| 2026 | $2 | $441,000 | $104,190 | $336,810 |
| 2025 | $4,017 | $441,000 | $104,190 | $336,810 |
| 2024 | $3,896 | $441,000 | $104,190 | $336,810 |
| 2023 | $3,868 | $441,000 | $104,190 | $336,810 |
| 2022 | $3,782 | $361,470 | $83,350 | $278,120 |
| 2021 | $3,512 | $317,330 | $74,420 | $242,910 |
| 2020 | $3,018 | $262,670 | $67,850 | $194,820 |
| 2019 | $2,562 | $242,890 | $62,970 | $179,920 |
| 2018 | $2,696 | $199,830 | $56,990 | $142,840 |
| 2017 | $2,318 | $199,830 | $56,990 | $142,840 |
| 2016 | $2,261 | $178,580 | $54,280 | $124,300 |
| 2015 | $2,187 | $175,140 | $54,280 | $120,860 |
| 2014 | -- | $174,660 | $58,660 | $116,000 |
| 2013 | -- | $174,660 | $58,660 | $116,000 |
Source: Public Records
Map
Nearby Homes
- 4646 SE Green Shores Dr
- 5544 Clover Valley Rd SE
- 5159 Country Club Way SE
- 6685 Skipper Ln SE
- 6498 Skipper Ln SE
- 6146 Windlass Ave SE
- 3707 SE Chesterton Dr
- 6223 Ebbert Dr SE
- 7443 Clover Valley Rd SE
- 3371 SE Bielmeier Rd Unit 85
- 3371 SE Bielmeier Rd Unit 47
- 3371 SE Bielmeier Rd Unit 26
- 3371 SE Bielmeier Rd Unit 91
- 3371 SE Bielmeier Rd Unit 79
- 3371 SE Bielmeier Rd Unit 80
- 3371 SE Bielmeier Rd Unit 95
- 3371 SE Bielmeier Rd Unit 33A
- 6814 Darla Ln SE
- 3341 SE Property Ct
- 4826 SE Sleepy Hollow Ct
- 4421 SE Firmont Dr
- 5950 Clover Valley Rd SE
- 5868 Clover Valley Rd SE
- 4429 SE Firmont Dr
- 4251 SE Greenshores Dr
- 4441 SE Firmont Dr
- 4573 SE Firmont Dr
- 0 .85AC SE Green Shores Dr
- 5814 Clover Valley Rd SE
- 4569 SE Firmont Dr
- 4574 SE Firmont Dr
- 4337 SE Greenshores Dr
- 5806 Lucille Ln SE
- 4447 SE Firmont Dr
- 4641 SE Cavalry Way
- 4639 SE Cavalry Way
- 4565 SE Firmont Dr
- 4440 SE Firmont Dr
- 5807 Lucille Ln SE