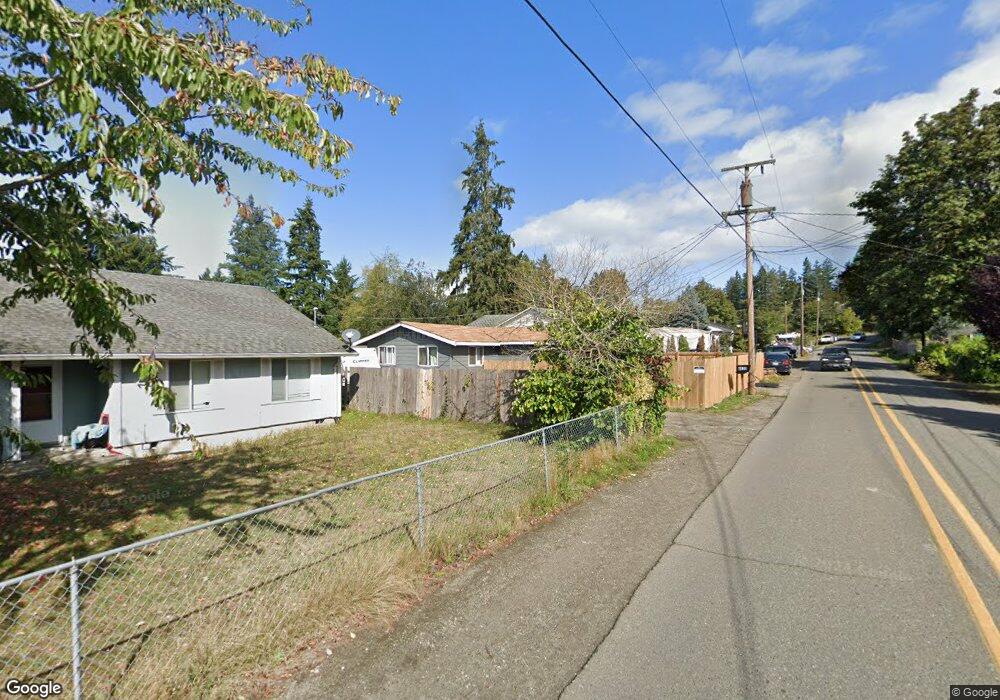
4603 SE Horstman Rd Port Orchard, WA 98366
Estimated Value: $239,000 - $360,000
2
Beds
1
Bath
732
Sq Ft
$437/Sq Ft
Est. Value
About This Home
This home is located at 4603 SE Horstman Rd, Port Orchard, WA 98366 and is currently estimated at $319,658, approximately $436 per square foot. 4603 SE Horstman Rd is a home located in Kitsap County with nearby schools including Orchard Heights Elementary School, Marcus Whitman Middle School, and South Kitsap High School.
Ownership History
Date
Name
Owned For
Owner Type
Purchase Details
Closed on
Oct 1, 2024
Sold by
Selbig Shanda R
Bought by
Selbig David R
Current Estimated Value
Purchase Details
Closed on
Jul 5, 2005
Sold by
Petersen Richard E and Petersen Hwa Cha
Bought by
Selbig David Raymond and Selbig Shanda Rose
Home Financials for this Owner
Home Financials are based on the most recent Mortgage that was taken out on this home.
Original Mortgage
$78,500
Interest Rate
5.51%
Mortgage Type
Purchase Money Mortgage
Purchase Details
Closed on
Dec 16, 1998
Sold by
Aames Capital Corp
Bought by
Petersen Richard E and Petersen Hwa Cha
Purchase Details
Closed on
May 26, 1998
Sold by
Posey Herbert G and Posey Sylvia L
Bought by
Aames Capital Corp
Purchase Details
Closed on
Aug 28, 1995
Sold by
Posey Herbert G
Bought by
Posey Herbert G and Posey Sylvia L
Create a Home Valuation Report for This Property
The Home Valuation Report is an in-depth analysis detailing your home's value as well as a comparison with similar homes in the area
Home Values in the Area
Average Home Value in this Area
Purchase History
| Date | Buyer | Sale Price | Title Company |
|---|---|---|---|
| Selbig David R | $313 | None Listed On Document | |
| Selbig David Raymond | $78,780 | Land Title Company | |
| Petersen Richard E | $25,500 | Transnation Title Insurance | |
| Aames Capital Corp | $29,723 | -- | |
| Posey Herbert G | -- | Stewart Title Co |
Source: Public Records
Mortgage History
| Date | Status | Borrower | Loan Amount |
|---|---|---|---|
| Previous Owner | Selbig David Raymond | $78,500 |
Source: Public Records
Tax History Compared to Growth
Tax History
| Year | Tax Paid | Tax Assessment Tax Assessment Total Assessment is a certain percentage of the fair market value that is determined by local assessors to be the total taxable value of land and additions on the property. | Land | Improvement |
|---|---|---|---|---|
| 2026 | $2,060 | $226,470 | $79,310 | $147,160 |
| 2025 | $2,060 | $226,470 | $79,310 | $147,160 |
| 2024 | $1,998 | $226,470 | $79,310 | $147,160 |
| 2023 | $1,984 | $226,470 | $79,310 | $147,160 |
| 2022 | $1,900 | $181,560 | $63,570 | $117,990 |
| 2021 | $1,835 | $166,210 | $60,540 | $105,670 |
| 2020 | $1,187 | $100,960 | $54,740 | $46,220 |
| 2019 | $1,030 | $95,400 | $51,620 | $43,780 |
| 2018 | $1,079 | $80,140 | $50,590 | $29,550 |
| 2017 | $949 | $80,140 | $50,590 | $29,550 |
| 2016 | $975 | $75,920 | $50,590 | $25,330 |
| 2015 | $952 | $75,260 | $50,590 | $24,670 |
| 2014 | -- | $74,590 | $50,590 | $24,000 |
| 2013 | -- | $91,580 | $53,250 | $38,330 |
Source: Public Records
Map
Nearby Homes
- 1400 Baby Doll Rd SE
- 4258 SE Woodford Ct
- 824 Cherub Place E
- 1200 Baby Doll Rd E
- 1242 Lidstrom Rd E
- 4010 SE Lovell St
- 4898 E Collins Rd
- 740 Tufts Ave E
- 1135 Hillandale Dr E
- 3930 SE Mile Hill Dr
- 1560 Woodridge Dr SE
- 3900 SE Mile Hill Dr
- 71 Carson Ave SE
- 3884 Madrona Dr SE
- 1663 Harrison Ave SE
- 0 Wendell Ave SE
- 803 Collins Creek Ln E
- 5101 SE Natchez Ct
- 1355 Ahlstrom Rd E
- 2169 Ponderosa Dr SE
- 4629 SE Horstman Rd
- 4589 SE Horstman Rd
- 4582 E Orchard Ln
- 4571 SE Horstman Rd
- 4630 SE Horstman Rd
- 4594 E Orchard Ln
- 4610 SE Horstman Rd
- 4500 SE Orchard Ln
- 4553 SE Horstman Rd
- 4678 SE Horstman Rd
- 4576 E Orchard Ln
- 4564 SE Horstman Rd
- 4708 SE Horstman Rd
- 4520 SE Orchard Ln
- 4520 E Orchard Ln
- 870 Baby Doll Rd SE
- 4579 SE Foss Rd
- 860 Baby Doll Rd SE
- 4557 SE Orchard Ln
- 4651 SE Foss Rd