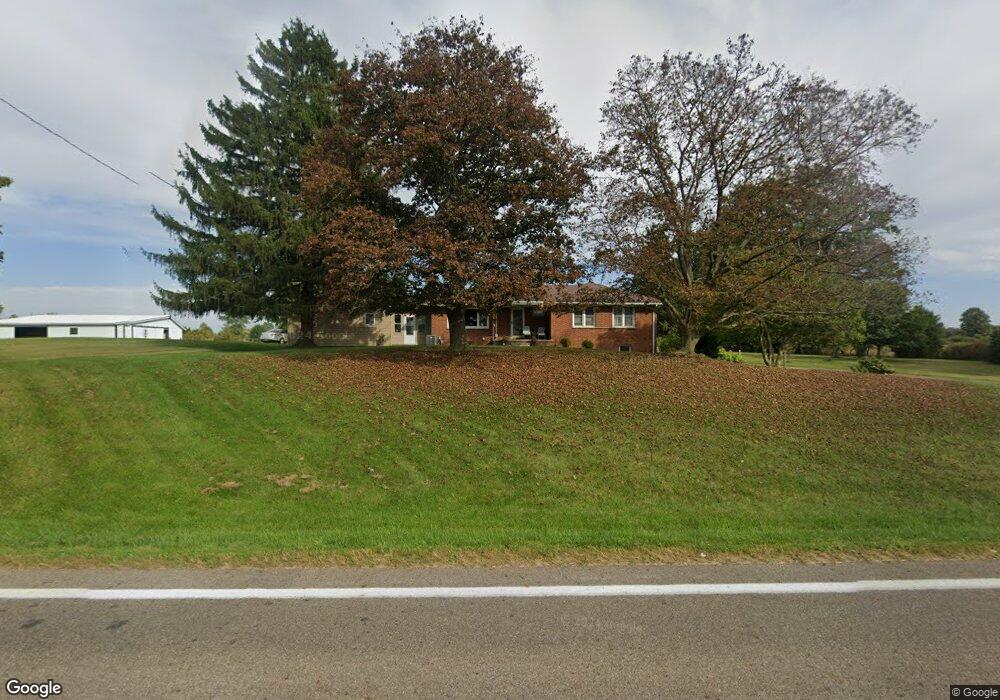
4603 State Route 61 Mount Gilead, OH 43338
Estimated Value: $275,504 - $368,000
3
Beds
2
Baths
1,344
Sq Ft
$236/Sq Ft
Est. Value
About This Home
This home is located at 4603 State Route 61, Mount Gilead, OH 43338 and is currently estimated at $316,876, approximately $235 per square foot. 4603 State Route 61 is a home located in Morrow County with nearby schools including Park Avenue Elementary School, Mt Gilead Middle School, and Mt Gilead High School.
Ownership History
Date
Name
Owned For
Owner Type
Purchase Details
Closed on
Feb 14, 2021
Sold by
Cleveland Kyle E
Bought by
Cleveland Laura G
Current Estimated Value
Home Financials for this Owner
Home Financials are based on the most recent Mortgage that was taken out on this home.
Original Mortgage
$154,000
Outstanding Balance
$137,736
Interest Rate
2.7%
Mortgage Type
Balloon
Estimated Equity
$179,140
Purchase Details
Closed on
Feb 21, 2017
Sold by
Landon Charlene E
Bought by
Cleveland Laura G and Cleveland Kyle E
Purchase Details
Closed on
Dec 4, 2003
Sold by
Barnum Lyle C and Barnum Janice M
Bought by
Landon Charlene E
Purchase Details
Closed on
Feb 9, 1999
Sold by
Smith Rheta M
Bought by
Barnum Lyle C and Barnum Janice M
Purchase Details
Closed on
Feb 17, 1998
Sold by
Smith Richard W
Bought by
Smith Rheta M
Purchase Details
Closed on
May 2, 1996
Bought by
Smith Richard W
Create a Home Valuation Report for This Property
The Home Valuation Report is an in-depth analysis detailing your home's value as well as a comparison with similar homes in the area
Home Values in the Area
Average Home Value in this Area
Purchase History
| Date | Buyer | Sale Price | Title Company |
|---|---|---|---|
| Cleveland Laura G | -- | None Available | |
| Cleveland Laura G | $170,000 | -- | |
| Landon Charlene E | $155,000 | -- | |
| Barnum Lyle C | $126,000 | -- | |
| Smith Rheta M | -- | -- | |
| Smith Richard W | -- | -- |
Source: Public Records
Mortgage History
| Date | Status | Borrower | Loan Amount |
|---|---|---|---|
| Open | Cleveland Laura G | $154,000 |
Source: Public Records
Tax History Compared to Growth
Tax History
| Year | Tax Paid | Tax Assessment Tax Assessment Total Assessment is a certain percentage of the fair market value that is determined by local assessors to be the total taxable value of land and additions on the property. | Land | Improvement |
|---|---|---|---|---|
| 2024 | $2,771 | $68,390 | $12,250 | $56,140 |
| 2023 | $2,771 | $68,390 | $12,250 | $56,140 |
| 2022 | $2,370 | $52,510 | $7,390 | $45,120 |
| 2021 | $2,246 | $52,510 | $7,390 | $45,120 |
| 2020 | $2,247 | $52,510 | $7,390 | $45,120 |
| 2019 | $1,904 | $44,110 | $6,200 | $37,910 |
| 2018 | $1,905 | $44,110 | $6,200 | $37,910 |
| 2017 | $1,875 | $44,110 | $6,200 | $37,910 |
| 2016 | $1,882 | $44,240 | $5,180 | $39,060 |
| 2015 | $1,765 | $44,240 | $5,180 | $39,060 |
| 2014 | $1,793 | $44,240 | $5,180 | $39,060 |
| 2013 | $1,788 | $46,590 | $5,460 | $41,130 |
Source: Public Records
Map
Nearby Homes
- 0 Township Road 110 Unit 6131011
- 4350 Township Road 110
- 5171 U S 42
- 4449 County Road 114
- 5098 County Road 237
- 4014 State Route 61
- 4719 Twp 115 Rd
- 250 S Main St
- 5280 Township Road 103
- 69 N Cherry St
- 236 W High St
- 264 W High St
- 251 Lincoln Ave
- 186 Iberia St
- 3845 Township Road 26
- 362 W High St
- 0 Iberia St
- 357 N Delaware St
- 0 Tamarack Unit 223034150
- 0 Lee St
- 4677 State Route 61
- 4644 State Route 61
- 4678 State Route 61
- 4550 State Route 61
- 3958 Township Road 110
- 3958 Township Road 110
- 3926 Township Road 110
- 4530 State Route 61
- 4689 State Route 61
- 3908 Township Road 110
- 3965 Township Road 110
- 3947 Township Road 110
- 3935 Township Road 110
- 3955 Township Road 110
- 4695 State Route 61
- 4706 State Route 61
- 0 Township 111 Rd Unit 3.24 223003915
- 4488 State Route 61
- 4054 Township Road 110
- 3854 Township Road 110