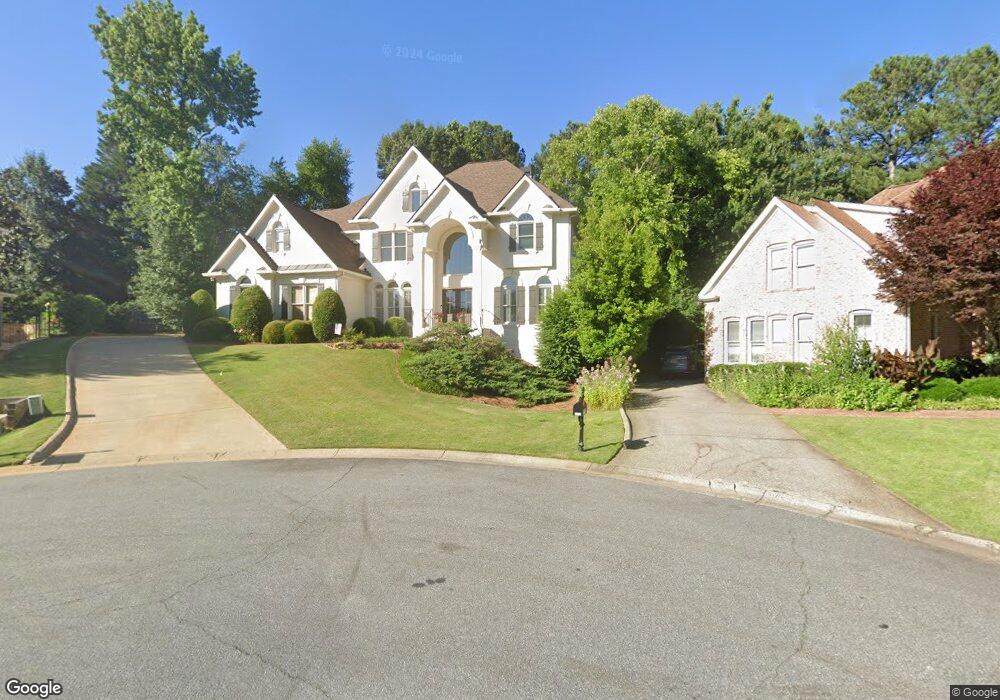
4604 Chartley Way NE Unit 2 Roswell, GA 30075
East Cobb NeighborhoodEstimated Value: $952,000 - $1,137,000
4
Beds
5
Baths
3,807
Sq Ft
$281/Sq Ft
Est. Value
About This Home
This home is located at 4604 Chartley Way NE Unit 2, Roswell, GA 30075 and is currently estimated at $1,070,849, approximately $281 per square foot. 4604 Chartley Way NE Unit 2 is a home located in Cobb County with nearby schools including Tritt Elementary School, Hightower Trail Middle School, and Pope High School.
Ownership History
Date
Name
Owned For
Owner Type
Purchase Details
Closed on
Sep 14, 2001
Sold by
Price Horace
Bought by
Bible Douglas J and Bible Gail M
Current Estimated Value
Home Financials for this Owner
Home Financials are based on the most recent Mortgage that was taken out on this home.
Original Mortgage
$299,900
Outstanding Balance
$115,463
Interest Rate
6.97%
Mortgage Type
New Conventional
Estimated Equity
$955,386
Purchase Details
Closed on
Nov 20, 1997
Sold by
Cbd Assoc
Bought by
Price Horace
Home Financials for this Owner
Home Financials are based on the most recent Mortgage that was taken out on this home.
Original Mortgage
$326,050
Interest Rate
6.62%
Mortgage Type
New Conventional
Create a Home Valuation Report for This Property
The Home Valuation Report is an in-depth analysis detailing your home's value as well as a comparison with similar homes in the area
Home Values in the Area
Average Home Value in this Area
Purchase History
| Date | Buyer | Sale Price | Title Company |
|---|---|---|---|
| Bible Douglas J | $499,900 | -- | |
| Price Horace | $388,000 | -- |
Source: Public Records
Mortgage History
| Date | Status | Borrower | Loan Amount |
|---|---|---|---|
| Open | Bible Douglas J | $299,900 | |
| Previous Owner | Price Horace | $326,050 |
Source: Public Records
Tax History Compared to Growth
Tax History
| Year | Tax Paid | Tax Assessment Tax Assessment Total Assessment is a certain percentage of the fair market value that is determined by local assessors to be the total taxable value of land and additions on the property. | Land | Improvement |
|---|---|---|---|---|
| 2025 | $2,485 | $412,208 | $88,000 | $324,208 |
| 2024 | $2,493 | $412,208 | $88,000 | $324,208 |
| 2023 | $2,121 | $356,600 | $78,000 | $278,600 |
| 2022 | $2,071 | $271,140 | $56,000 | $215,140 |
| 2021 | $2,084 | $275,284 | $56,000 | $219,284 |
| 2020 | $2,084 | $275,284 | $56,000 | $219,284 |
| 2019 | $2,084 | $275,284 | $56,000 | $219,284 |
| 2018 | $7,098 | $275,284 | $56,000 | $219,284 |
| 2017 | $5,893 | $230,776 | $50,000 | $180,776 |
| 2016 | $5,901 | $230,776 | $50,000 | $180,776 |
| 2015 | $6,028 | $230,776 | $50,000 | $180,776 |
| 2014 | $5,603 | $209,984 | $0 | $0 |
Source: Public Records
Map
Nearby Homes
- 3333 Trails End Rd NE
- 1533 Tennessee Walker Dr NE
- 2990 Mountain Trace NE
- 4645 Shallowford Rd
- 3025 Creek Ct NE
- 4618 Shallowford Rd
- 4574 Woodland Cir NE
- 230 Tynebrae Place Unit 1
- 2095 Shallowford Park Manor
- 2859 Tynewick Dr NE
- 4486 Huffman Dr NE
- 4680 Cambridge Approach Cir NE
- 3226 Artessa Ln NE
- 4448 Huffman Dr NE
- 3277 Artessa Ln NE
- 3453 Drayton Dr NE
- 3231 Artessa Ln NE
- 4600 Chartley Way NE
- 4501 Chartley Cir NE Unit 2
- 4608 Chartley Way NE
- 4505 Chartley Cir NE
- 4603 Chartley Way NE
- 4612 Chartley Way NE
- 0 Tennessee Walker Dr NE Unit 8609336
- 0 Tennessee Walker Dr NE Unit 8579440
- 0 Tennessee Walker Dr NE Unit 8192651
- 0 Tennessee Walker Dr NE Unit 8202939
- 0 Tennessee Walker Dr NE Unit 8582334
- 0 Tennessee Walker Dr NE Unit 8455335
- 0 Tennessee Walker Dr NE Unit 8228651
- 0 Tennessee Walker Dr NE Unit 8485998
- 0 Tennessee Walker Dr NE Unit 8982023
- 0 Tennessee Walker Dr NE Unit 8982075
- 0 Tennessee Walker Dr NE Unit 8716280
- 0 Tennessee Walker Dr NE Unit 8740136
- 0 Tennessee Walker Dr NE Unit 8819151
- 0 Tennessee Walker Dr NE Unit 3222120