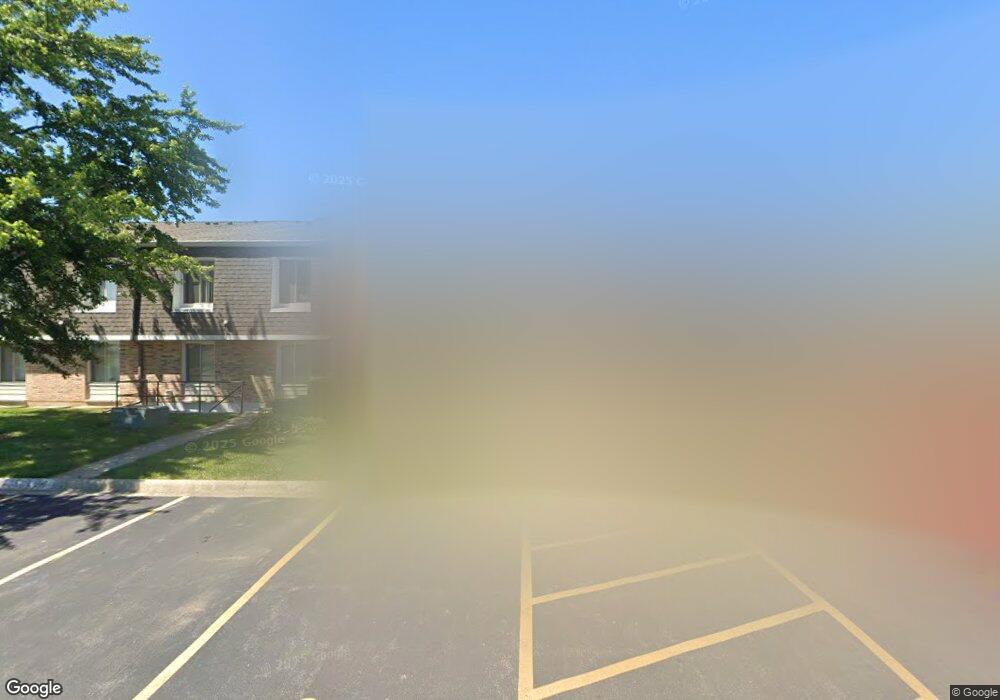
4604 Kings Walk Dr Unit 1A Rolling Meadows, IL 60008
Plum Grove Village NeighborhoodEstimated Value: $194,789 - $209,000
1
Bed
4
Baths
900
Sq Ft
$224/Sq Ft
Est. Value
About This Home
This home is located at 4604 Kings Walk Dr Unit 1A, Rolling Meadows, IL 60008 and is currently estimated at $201,947, approximately $224 per square foot. 4604 Kings Walk Dr Unit 1A is a home located in Cook County with nearby schools including Central Road Elementary School, William Fremd High School, and Immanuel Lutheran School.
Ownership History
Date
Name
Owned For
Owner Type
Purchase Details
Closed on
Jul 22, 2011
Sold by
Federal Home Loan Mortgage Corporation
Bought by
Leng Qiuming and Jiang Jane C
Current Estimated Value
Purchase Details
Closed on
Feb 25, 2005
Sold by
Mante Eden M
Bought by
Melo Marc P and Melo Fe
Home Financials for this Owner
Home Financials are based on the most recent Mortgage that was taken out on this home.
Original Mortgage
$150,000
Interest Rate
7.37%
Mortgage Type
Purchase Money Mortgage
Purchase Details
Closed on
Feb 10, 1995
Sold by
American National Bk & Tr Co Of Chicago
Bought by
Mante Eden M
Home Financials for this Owner
Home Financials are based on the most recent Mortgage that was taken out on this home.
Original Mortgage
$75,000
Interest Rate
8.87%
Create a Home Valuation Report for This Property
The Home Valuation Report is an in-depth analysis detailing your home's value as well as a comparison with similar homes in the area
Home Values in the Area
Average Home Value in this Area
Purchase History
| Date | Buyer | Sale Price | Title Company |
|---|---|---|---|
| Leng Qiuming | $61,000 | Attorneys Title Guaranty Fun | |
| Melo Marc P | $150,000 | Rtc | |
| Mante Eden M | $79,000 | Ticor Title Insurance |
Source: Public Records
Mortgage History
| Date | Status | Borrower | Loan Amount |
|---|---|---|---|
| Previous Owner | Melo Marc P | $150,000 | |
| Previous Owner | Mante Eden M | $75,000 |
Source: Public Records
Tax History Compared to Growth
Tax History
| Year | Tax Paid | Tax Assessment Tax Assessment Total Assessment is a certain percentage of the fair market value that is determined by local assessors to be the total taxable value of land and additions on the property. | Land | Improvement |
|---|---|---|---|---|
| 2024 | $4,327 | $13,706 | $2,076 | $11,630 |
| 2023 | $4,166 | $13,706 | $2,076 | $11,630 |
| 2022 | $4,166 | $13,706 | $2,076 | $11,630 |
| 2021 | $3,334 | $9,753 | $1,037 | $8,716 |
| 2020 | $3,281 | $9,753 | $1,037 | $8,716 |
| 2019 | $3,273 | $10,823 | $1,037 | $9,786 |
| 2018 | $2,354 | $7,032 | $963 | $6,069 |
| 2017 | $2,306 | $7,032 | $963 | $6,069 |
| 2016 | $2,146 | $7,032 | $963 | $6,069 |
| 2015 | $2,460 | $7,539 | $889 | $6,650 |
| 2014 | $2,407 | $7,539 | $889 | $6,650 |
| 2013 | $2,348 | $7,539 | $889 | $6,650 |
Source: Public Records
Map
Nearby Homes
- 1808 Plum Grove Rd Unit 1B
- 4602 Euclid Ave Unit 2A
- 4512 Kings Walk Dr Unit 1D
- 1779 California Ave
- 4 Eton on Oxford
- 912 S Plum Grove Rd Unit 321
- 2 Croydon on Duxbury
- 904 S Plum Grove Rd Unit 301
- 4373 Lincoln Ave
- 2041 Vermont St
- 36 W Fern Ct Unit 117B
- 4301 Euclid Ave
- 805 S Benton St
- 3 E Orchard Ln
- 4941 Emerson Ave
- 724 S Plum Grove Rd
- 712 S Plum Grove Rd
- 278 W Illinois Ave
- 160 E Forest Ln
- 123 Honeysuckle Ct
- 4604 Kings Walk Dr Unit 2A
- 4604 Kings Walk Dr Unit 46041
- 4604 Kings Walk Dr Unit 46042
- 4604 Kings Walk Dr Unit 46041
- 4604 Kings Walk Dr Unit 46041
- 4604 Kings Walk Dr Unit 46041
- 4604 Kings Walk Dr Unit 46042
- 4604 Kings Walk Dr Unit 46042
- 4604 Kings Walk Dr Unit 46042
- 4604 Kings Walk Dr Unit 2D
- 4604 Kings Walk Dr Unit 2B
- 4604 Kings Walk Dr Unit 1D
- 4604 Kings Walk Dr Unit 1C
- 4610 Kings Walk Dr Unit 46101
- 4610 Kings Walk Dr Unit 46101
- 4610 Kings Walk Dr Unit 46102
- 4610 Kings Walk Dr Unit 46101
- 4610 Kings Walk Dr Unit 46102
- 4610 Kings Walk Dr Unit 46102
- 4610 Kings Walk Dr Unit 46102