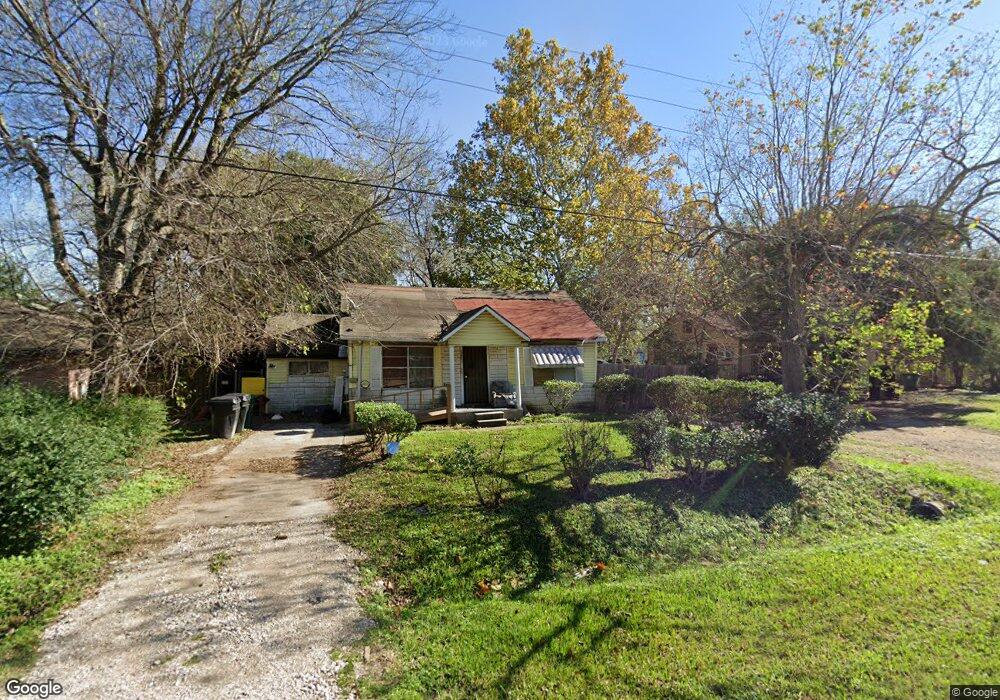
4604 Leffingwell St Houston, TX 77026
Kashmere Gardens NeighborhoodEstimated Value: $223,000 - $288,000
2
Beds
2
Baths
1,260
Sq Ft
$198/Sq Ft
Est. Value
About This Home
This home is located at 4604 Leffingwell St, Houston, TX 77026 and is currently estimated at $249,263, approximately $197 per square foot. 4604 Leffingwell St is a home located in Harris County with nearby schools including Kashmere Gardens Elementary School, Key Middle, and Kashmere High School.
Ownership History
Date
Name
Owned For
Owner Type
Purchase Details
Closed on
Sep 22, 2022
Sold by
Blake Charles Ray
Bought by
Blake Percy L
Current Estimated Value
Purchase Details
Closed on
Nov 9, 2009
Sold by
Blake Charles
Bought by
Blake Percy L
Purchase Details
Closed on
Nov 13, 2007
Sold by
Blake Waldean A
Bought by
The Bank Of New York Trust Co Na and Jpmorgan Chase Bank Na
Purchase Details
Closed on
Oct 18, 2005
Sold by
Blake Waldean A and Blake Percy L
Bought by
Blake Charles
Home Financials for this Owner
Home Financials are based on the most recent Mortgage that was taken out on this home.
Original Mortgage
$60,000
Interest Rate
5.69%
Mortgage Type
Purchase Money Mortgage
Purchase Details
Closed on
Dec 28, 2000
Sold by
Blake Percy L and Blake Waldean A
Bought by
J B Adams Grade School Inc
Create a Home Valuation Report for This Property
The Home Valuation Report is an in-depth analysis detailing your home's value as well as a comparison with similar homes in the area
Home Values in the Area
Average Home Value in this Area
Purchase History
| Date | Buyer | Sale Price | Title Company |
|---|---|---|---|
| Blake Percy L | -- | -- | |
| Blake Percy L | -- | -- | |
| Blake Percy L | -- | None Available | |
| The Bank Of New York Trust Co Na | -- | Ticor Title Ins Co Of Fl | |
| Blake Charles | -- | -- | |
| J B Adams Grade School Inc | -- | American Title Co |
Source: Public Records
Mortgage History
| Date | Status | Borrower | Loan Amount |
|---|---|---|---|
| Previous Owner | Blake Charles | $60,000 |
Source: Public Records
Tax History Compared to Growth
Tax History
| Year | Tax Paid | Tax Assessment Tax Assessment Total Assessment is a certain percentage of the fair market value that is determined by local assessors to be the total taxable value of land and additions on the property. | Land | Improvement |
|---|---|---|---|---|
| 2025 | $1,465 | $209,833 | $68,081 | $141,752 |
| 2024 | $1,465 | $281,338 | $68,081 | $213,257 |
| 2023 | $1,465 | $123,348 | $62,297 | $61,051 |
| 2022 | $1,456 | $94,650 | $44,498 | $50,152 |
| 2021 | $1,401 | $72,325 | $31,148 | $41,177 |
| 2020 | $1,323 | $65,659 | $31,148 | $34,511 |
| 2019 | $1,257 | $49,673 | $17,799 | $31,874 |
| 2018 | $0 | $49,935 | $19,124 | $30,811 |
| 2017 | $1,263 | $49,935 | $19,124 | $30,811 |
| 2016 | $1,263 | $49,935 | $19,124 | $30,811 |
| 2015 | $158 | $54,588 | $15,299 | $39,289 |
| 2014 | $158 | $54,588 | $15,299 | $39,289 |
Source: Public Records
Map
Nearby Homes
- 4501 Hirsch Rd
- 4520 Falls St
- 0 Falls St
- 4502 Hirsch Rd Unit A
- 4108 Falls St
- 4513 Los Angeles St
- 00 Los Angeles St
- 0001 Cavalcade St
- 3810a-b Cavalcade St
- 4810 Hirsch Rd
- 5914 Wayne St
- 4305 Los Angeles St
- 4817 Los Angeles St
- 4819 Los Angeles St
- 0 0 Scenic Rd
- 4215 Los Angeles St
- 3717 Sayers St
- 4918 Leffingwell St
- 4919 Falls St
- 4611 W Hunting St
- 4606 Leffingwell St
- 4602 Leffingwell St
- 4608 Leffingwell St
- 4518 Leffingwell St
- 4601 Leffingwell St Unit B
- 4601 Leffingwell St Unit A
- 4514 Leffingwell St
- 4612 Leffingwell St
- 4517 Hirsch Rd
- 4603 Leffingwell St
- 4509 Hirsch Rd
- 4614 Leffingwell St
- 4517 Leffingwell St
- 4506 Leffingwell St
- 4609 Leffingwell St
- 4613 Hirsch Rd
- 4515 Leffingwell St
- 4605 Leffingwell St
- 4522 Falls St
- 4611 Leffingwell St