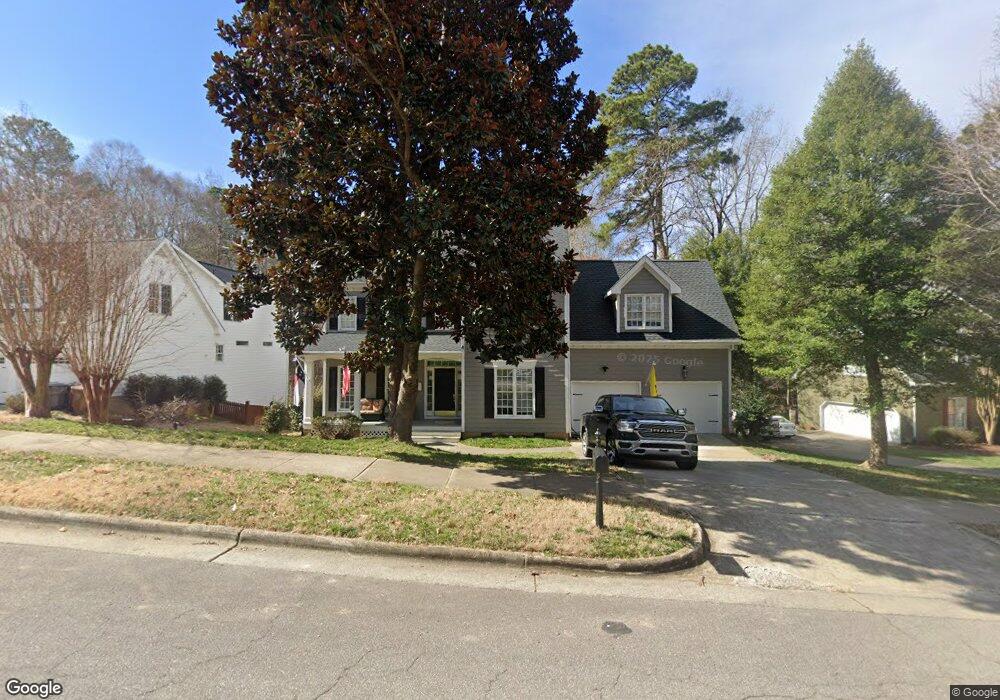
4604 Linksland Dr Holly Springs, NC 27540
Estimated Value: $630,000 - $774,000
5
Beds
3
Baths
3,100
Sq Ft
$226/Sq Ft
Est. Value
About This Home
This home is located at 4604 Linksland Dr, Holly Springs, NC 27540 and is currently estimated at $701,272, approximately $226 per square foot. 4604 Linksland Dr is a home located in Wake County with nearby schools including Holly Springs Elementary School, Holly Ridge Middle School, and Holly Springs High School.
Ownership History
Date
Name
Owned For
Owner Type
Purchase Details
Closed on
Jul 6, 2004
Sold by
Federal Home Loan Mortgage Corporation
Bought by
Salkeld Matthew F and Salkeld Kerri M
Current Estimated Value
Home Financials for this Owner
Home Financials are based on the most recent Mortgage that was taken out on this home.
Original Mortgage
$230,000
Outstanding Balance
$115,055
Interest Rate
6.24%
Mortgage Type
Purchase Money Mortgage
Estimated Equity
$586,218
Purchase Details
Closed on
Feb 27, 2004
Sold by
Wise Conway Glenn William and Wise Conway Alice
Bought by
Federal Home Loan Mortgage Corporation
Purchase Details
Closed on
Sep 22, 2000
Sold by
Helton Homes Inc
Bought by
Conway Glenn William and Conway Alice Wise
Home Financials for this Owner
Home Financials are based on the most recent Mortgage that was taken out on this home.
Original Mortgage
$219,900
Interest Rate
8.05%
Purchase Details
Closed on
Dec 21, 1999
Sold by
Sunset Forest Llc
Bought by
Helton Homes Inc
Create a Home Valuation Report for This Property
The Home Valuation Report is an in-depth analysis detailing your home's value as well as a comparison with similar homes in the area
Home Values in the Area
Average Home Value in this Area
Purchase History
| Date | Buyer | Sale Price | Title Company |
|---|---|---|---|
| Salkeld Matthew F | -- | -- | |
| Federal Home Loan Mortgage Corporation | $240,519 | -- | |
| Conway Glenn William | $275,000 | -- | |
| Helton Homes Inc | $73,000 | -- |
Source: Public Records
Mortgage History
| Date | Status | Borrower | Loan Amount |
|---|---|---|---|
| Open | Salkeld Matthew F | $230,000 | |
| Previous Owner | Conway Glenn William | $219,900 | |
| Closed | Conway Glenn William | $41,211 |
Source: Public Records
Tax History Compared to Growth
Tax History
| Year | Tax Paid | Tax Assessment Tax Assessment Total Assessment is a certain percentage of the fair market value that is determined by local assessors to be the total taxable value of land and additions on the property. | Land | Improvement |
|---|---|---|---|---|
| 2025 | $5,346 | $618,856 | $140,000 | $478,856 |
| 2024 | $5,324 | $618,856 | $140,000 | $478,856 |
| 2023 | $4,295 | $396,369 | $75,000 | $321,369 |
| 2022 | $4,147 | $396,369 | $75,000 | $321,369 |
| 2021 | $4,069 | $396,369 | $75,000 | $321,369 |
| 2020 | $4,069 | $396,369 | $75,000 | $321,369 |
| 2019 | $4,016 | $332,106 | $80,000 | $252,106 |
| 2018 | $3,630 | $332,106 | $80,000 | $252,106 |
| 2017 | $3,499 | $332,106 | $80,000 | $252,106 |
| 2016 | $3,451 | $332,106 | $80,000 | $252,106 |
| 2015 | $3,509 | $332,420 | $78,000 | $254,420 |
| 2014 | $3,387 | $332,420 | $78,000 | $254,420 |
Source: Public Records
Map
Nearby Homes
- 204 Crossway Ln
- 129 Starwood Ln
- 215 Savannah Ridge Rd Unit 215
- 305 Savannah Ridge Rd
- 0/416 Holly Springs Rd
- 112 Midden Way
- 4809 Greenpoint Ln
- 228 Masden Rd
- 201 Seagraves Creek Ln
- 225 Old Ride Dr
- 5620 Lockley Rd
- 204 Seagraves Creek Ln
- 200 Seagraves Creek Ln
- 113 Seagraves Creek Ln
- 124 Seagraves Creek Ln
- 120 Seagraves Creek Ln
- 116 Seagraves Creek Ln
- 155 Writing Rock Place
- 109 Willow View Ln
- 127 Willow View Ln
- 4608 Linksland Dr
- 4600 Linksland Dr
- 406 Kingsport Rd
- 4700 Linksland Dr
- 101 Ontario Place
- 100 Starwood Ln
- 109 Creekhill Dr
- 4704 Linksland Dr
- 409 Kingsport Rd
- 113 Creekhill Dr
- 105 Ontario Place
- 100 Ontario Place
- 101 Starwood Ln
- 104 Starwood Ln
- 105 Creekhill Dr
- 405 Kingsport Rd
- 4708 Linksland Dr
- 104 Ontario Place
- 300 Crossway Ln
- 105 Starwood Ln