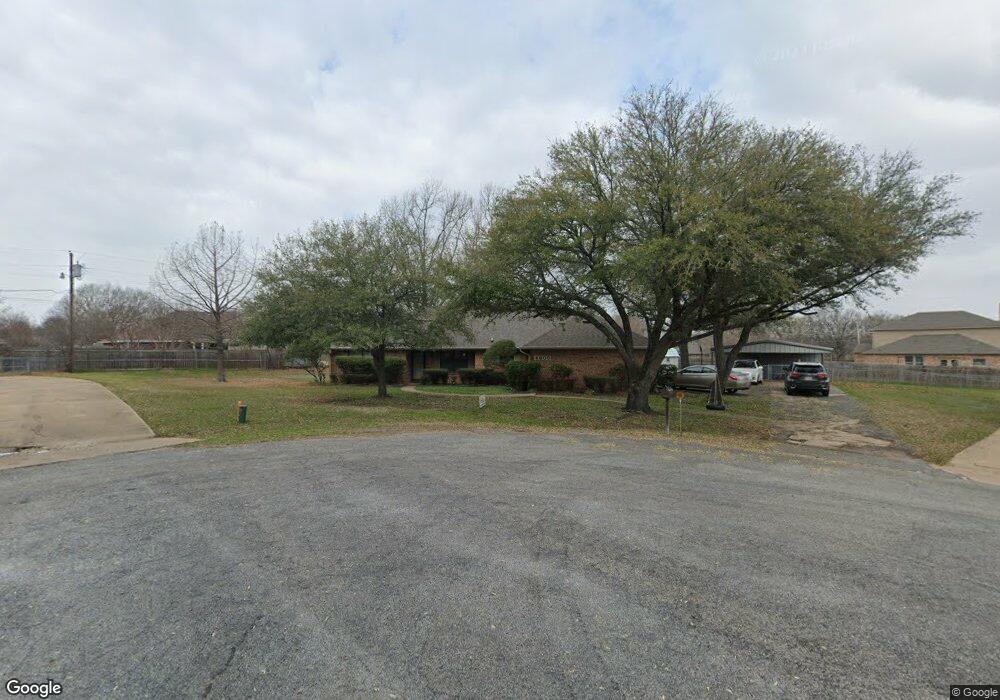
4605 Bello Vista Cir Sherman, TX 75090
Estimated Value: $266,623 - $316,000
3
Beds
2
Baths
1,754
Sq Ft
$170/Sq Ft
Est. Value
About This Home
This home is located at 4605 Bello Vista Cir, Sherman, TX 75090 and is currently estimated at $298,156, approximately $169 per square foot. 4605 Bello Vista Cir is a home located in Grayson County with nearby schools including Percy W. Neblett Elementary School, Dillingham Intermediate School, and Piner Middle School.
Ownership History
Date
Name
Owned For
Owner Type
Purchase Details
Closed on
Aug 27, 2010
Sold by
Secretary Of Veterans Affairs
Bought by
Pennington Vina Sue
Current Estimated Value
Home Financials for this Owner
Home Financials are based on the most recent Mortgage that was taken out on this home.
Original Mortgage
$73,150
Interest Rate
4.06%
Mortgage Type
New Conventional
Purchase Details
Closed on
Feb 7, 2010
Sold by
Walters Andrew J and Walters Sherri K
Bought by
Bac Home Loans Servicing Lp
Purchase Details
Closed on
Jan 5, 2010
Sold by
Bac Home Loans Servicing Lp
Bought by
Secretary Of Veterans Affairs
Purchase Details
Closed on
Jun 15, 2006
Sold by
Desjardins Roland J and Desjardins Marilyn
Bought by
Walters Andrew J and Walters Sherri K
Home Financials for this Owner
Home Financials are based on the most recent Mortgage that was taken out on this home.
Original Mortgage
$129,730
Interest Rate
6.58%
Mortgage Type
VA
Create a Home Valuation Report for This Property
The Home Valuation Report is an in-depth analysis detailing your home's value as well as a comparison with similar homes in the area
Home Values in the Area
Average Home Value in this Area
Purchase History
| Date | Buyer | Sale Price | Title Company |
|---|---|---|---|
| Pennington Vina Sue | -- | Red River Title Co | |
| Bac Home Loans Servicing Lp | $96,943 | None Available | |
| Secretary Of Veterans Affairs | -- | Lsi Title Agency Inc | |
| Walters Andrew J | -- | Red River Title Co |
Source: Public Records
Mortgage History
| Date | Status | Borrower | Loan Amount |
|---|---|---|---|
| Closed | Pennington Vina Sue | $73,150 | |
| Previous Owner | Walters Andrew J | $129,730 |
Source: Public Records
Tax History Compared to Growth
Tax History
| Year | Tax Paid | Tax Assessment Tax Assessment Total Assessment is a certain percentage of the fair market value that is determined by local assessors to be the total taxable value of land and additions on the property. | Land | Improvement |
|---|---|---|---|---|
| 2025 | $696 | $208,600 | $55,763 | $152,837 |
| 2024 | $4,563 | $208,063 | $0 | $0 |
| 2023 | $696 | $189,148 | $0 | $0 |
| 2022 | $4,030 | $171,953 | $0 | $0 |
| 2021 | $3,918 | $165,879 | $25,633 | $140,246 |
| 2020 | $3,730 | $160,961 | $25,633 | $135,328 |
| 2019 | $3,482 | $152,877 | $29,274 | $123,603 |
| 2018 | $2,947 | $139,720 | $29,274 | $110,446 |
| 2017 | $2,658 | $132,977 | $29,274 | $103,703 |
| 2016 | $2,416 | $126,567 | $29,274 | $97,293 |
| 2015 | $1,746 | $88,239 | $9,758 | $78,481 |
| 2014 | $1,880 | $87,826 | $11,939 | $75,887 |
Source: Public Records
Map
Nearby Homes
- 4604 Bello Vista Cir
- 5585 S Fannin Ave
- 4517 Playa Ct
- 30 Tananger Springs Dr
- 918 Cleve Cole
- 376 Tananger Springs Dr
- 4605 Dripping Spring Rd
- TBD 1 Dripping Spring Rd
- 2025 Woodlake Rd
- 257 Russell Ln
- 327 Russell Ln
- 461 Cleve Cole Rd
- 486 Cleve Cole Rd
- 492 Russell Ln
- 4813 Pinnacle Place
- TBD Cleve Cole Rd
- 2014 & 1910 Shannon Rd
- 811 Russell Ln
- 3426 Tomahawk Dr
- 3417 Tomahawk Dr
- 4609 Bello Vista Cir
- 5609 Camino Dos Lagos Dr
- 4604 Woodlawn Rd
- 5605 Camino Dos Lagos Dr
- 4608 Woodlawn Rd
- 4608 Bello Vista Cir
- 4701 Bello Vista Cir
- 5601 Camino Dos Lagos Dr
- 4600 Woodlawn Rd
- 4700 Woodlawn Rd
- 4516 Woodlawn Rd
- 4705 Bello Vista Cir
- 5517 Camino Dos Lagos Dr
- 4700 Bello Vista Cir
- 4517 Arroyo Trail
- 4512 Woodlalwn Rd
- 4709 Bello Vista Cir
- 4512 Woodlawn Rd
- 5504 Bello Vista Dr
- 4704 Bello Vista Cir