4605 Sapp Rd Concord, NC 28025
3
Beds
2
Baths
2,186
Sq Ft
445,183
Sq Ft Lot
About This Home
This home is located at 4605 Sapp Rd, Concord, NC 28025. 4605 Sapp Rd is a home located in Cabarrus County with nearby schools including Mount Pleasant Elementary School, Mount Pleasant Middle School, and Mount Pleasant High School.
Create a Home Valuation Report for This Property
The Home Valuation Report is an in-depth analysis detailing your home's value as well as a comparison with similar homes in the area
Home Values in the Area
Average Home Value in this Area
Tax History
| Year | Tax Paid | Tax Assessment Tax Assessment Total Assessment is a certain percentage of the fair market value that is determined by local assessors to be the total taxable value of land and additions on the property. | Land | Improvement |
|---|---|---|---|---|
| 2024 | $3,083 | $456,130 | $225,330 | $230,800 |
| 2023 | $2,275 | $270,850 | $118,590 | $152,260 |
| 2022 | $1,998 | $242,860 | $118,590 | $124,270 |
| 2021 | $1,998 | $242,860 | $118,590 | $124,270 |
| 2020 | $1,998 | $242,860 | $118,590 | $124,270 |
| 2019 | $2,117 | $257,370 | $118,590 | $138,780 |
| 2018 | $1,724 | $214,780 | $118,590 | $96,190 |
| 2017 | $1,681 | $214,780 | $118,590 | $96,190 |
| 2016 | -- | $206,290 | $118,590 | $87,700 |
| 2015 | $1,449 | $206,290 | $118,590 | $87,700 |
| 2014 | $1,449 | $206,290 | $118,590 | $87,700 |
Source: Public Records
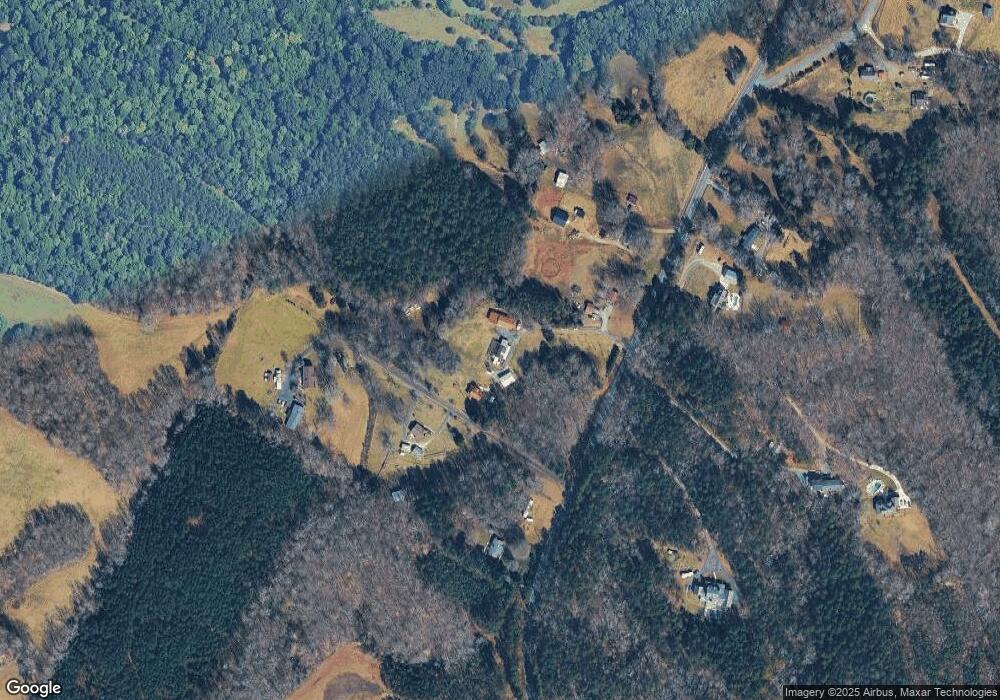
Map
Nearby Homes
- 5295 Sapp Rd
- 5119 Teakwood Dr
- 5391 Sapp Rd
- 5027 Old Salisbury Concord Rd
- 5875 Irish Potato Rd
- 3397 Camp Julia Rd
- 3215 Penny Earley Ln
- 6230 Lumber Ln
- 3246 Camp Julia Rd
- 410 Geneva Dr
- 2630 Sides Rd
- 2707 Ireton Place
- 2850 Irish Potato Rd
- 2640 Centergrove Rd
- 11237 Old Concord Rd
- 3178 Foxford Dr
- 2613 Lane St
- 838 Anchor Way NE
- 145 Wellington Estates Dr
- 1103 Hastings Ct
Your Personal Tour Guide
Ask me questions while you tour the home.